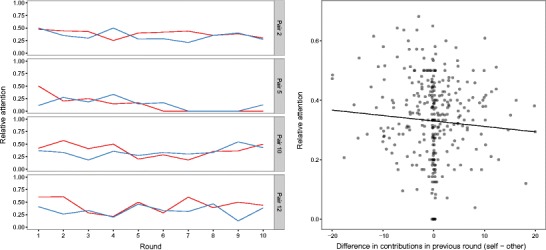
Fig. 6.

(Left) Evolution of relative attention (Eq. 1) within each of four selected pairs of players. (Right) Relative attention as a function of the difference between a player’s own contribution and that of the other player. The negatively sloped regression line indicates that the more a participant contributes relative to the other participant, the more the participant pays attention to the information concerning the other player
