Figure 4.
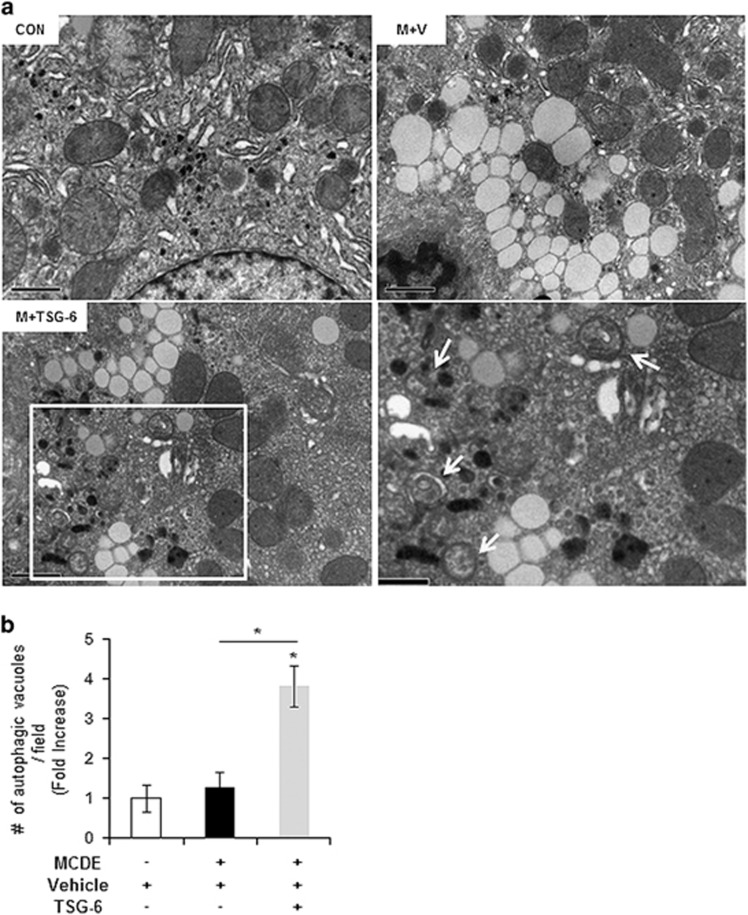
Ultrastructural analysis shows increasing autophagy formation in damaged livers with TSG-6 treatment. (a) EM analysis showing the elevated autophagy formation (indicated by arrows) in livers of TSG-6-treated mice. These autophagy structures were rarely detected in livers of the CON and M+V groups. The inset box in the image was magnified in the lower-right image. Representative images are shown (Scale bar: 1 μm). (b) Morphometric data of the autophagic vacuoles from all mice were plotted as the mean±s.d. results (*P<0.05).

