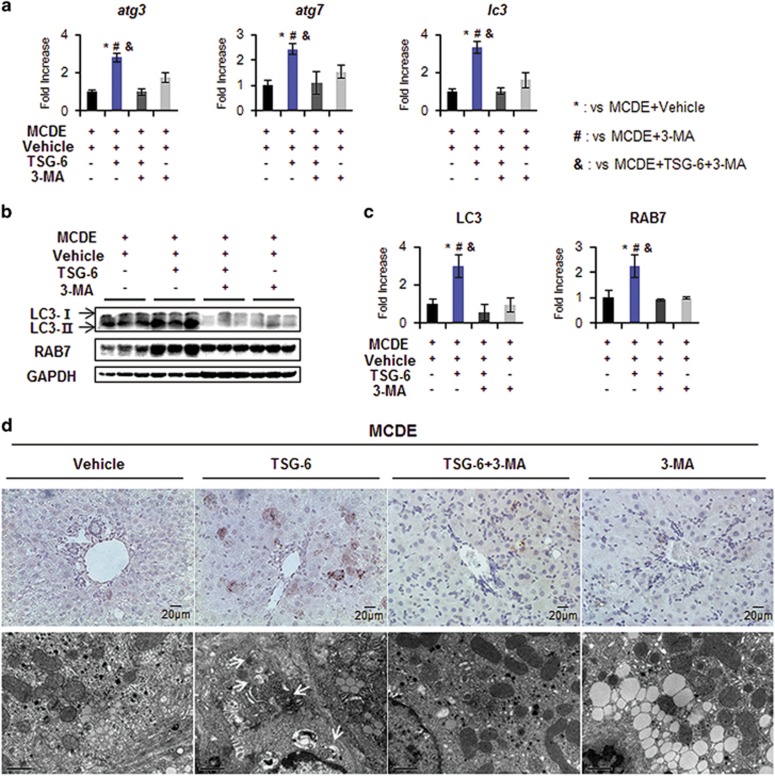
Figure 8.
3-MA suppresses TSG-6-mediated autophagy in livers of MCDE-fed mice. (a) qRT-PCR analysis of atg3, atg7 and lc3 in livers from the M+V, M+TSG-6, M+TSG-6+3-MA and M+3-MA groups. Mean±s.d. results are plotted (n⩾4 mice per group) (*P<0.05 vs M+V, #P<0.05 vs M+3-MA, &P<0.05 vs M+TSG-6+3-MA). (b) Western blot analysis and (c) cumulative densitometry analyses for LC3-II and RAB7 in livers of three representative mice from these groups. GAPDH was used as an internal CON. Data shown represent one of three experiments with similar results. The results are displayed as the mean±s.d. (n⩾4 mice per group) (*P<0.05 vs M+V, #P<0.05 vs M+3-MA, &P<0.05 vs M+TSG-6+3-MA). (d) Representative images of IHC for LC3-II (upper panel, × 40) and EM in liver sections from these groups (arrows indicate autophagy structures. Scale bar: 1 μm).

