. 2017 Jul 5;8(9):6218–6229. doi: 10.1039/c7sc01619k

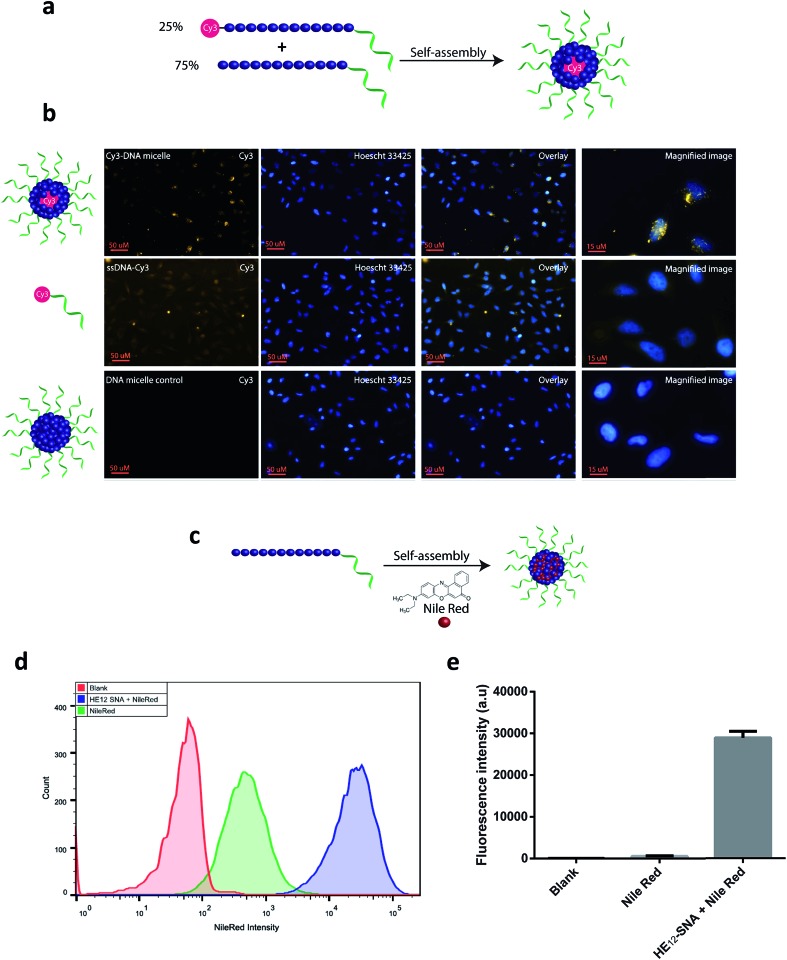
Fig. 4. Cellular localization of HE12–DNA nanoparticles and encapsulated cargo. (a) Preparation of Cy3–labeled nanoparticles. Cy3–HE12–DNA and HE12–DNA were mixed in 25 : 75 molar ratios to generate nearly monodisperse Cy3-labeled HE12–DNA nanoparticles. (b) Confocal microscopy images demonstrating the cellular uptake of Cy3-labeled particles in HeLa cells after 24 hour incubation. (c) Preparation of Nile Red-loaded DNA nanoparticles. (d) Flow cytometry measurements showing the increased uptake of Nile Red when delivered by HE12–SNAs. All samples were incubated for 12 hours, [Nile Red] = 375 nM in cell culture media. Nile Red images were acquired using exc. 516 nm and YellowG_670/30 filter. (e) Quantification of Nile Red intensity measured by flow cytometry. All measurements were performed in triplicates, and the error bars represent the standard deviation of measurements.

Fig. 4