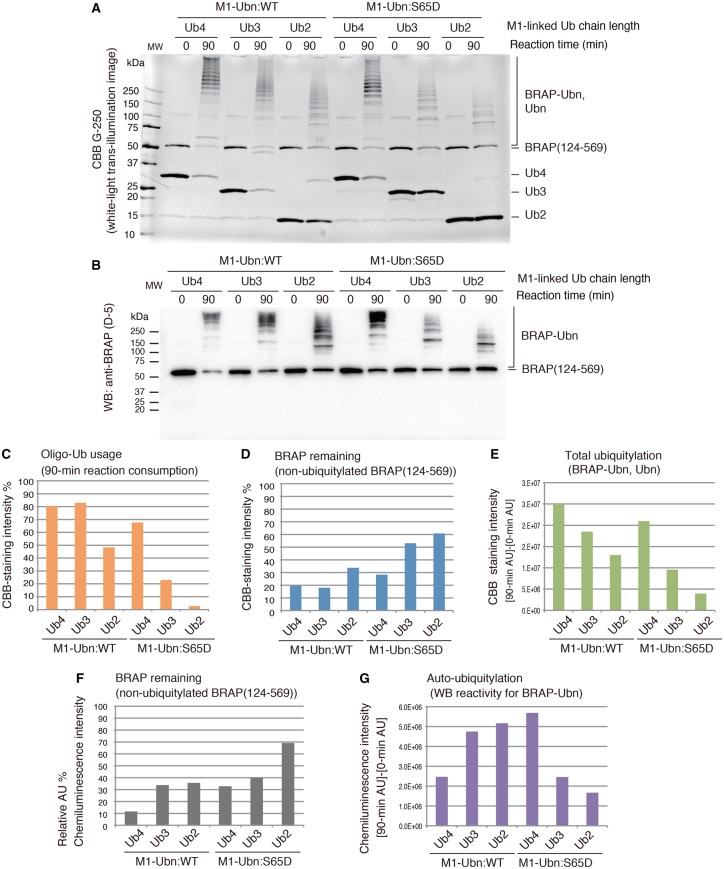
Figure 6. E3 activity of the RNF52 domain of BRAP against M1-linked di-, tri-, and tetra-ubiquitin chains (ubiquitin oligomers) and the phosphomimetic form that consists of S65D ubiquitin mutant.
Ubiquitylation assays of the BRAP (124–569) fragment (RNF52 domain of BRAP) in the presence of UBA1, UBE2D1, and M1-linked di-, tri-, and tetra-ubiquitin oligomers (Ub2, Ub3, and Ub4) or their phosphomimetic forms, which consist of the phosphorylation-mimic ubiquitin mutant S65D. (A) SDS–PAGE gels of the ubiquitylation reaction products stained with CBB G-250. (B) WB of the same samples as in (A) probed with an anti-BRAP antibody (clone D-5). (C–G) The band signals on CBB-stained gels and WB were quantified using the ImageQuant TL software. (C) Oligo-Ub usage was calculated by determining what percentage of the band had disappeared after a 90-min reaction, assuming that the band signal of the unshifted bands for the ubiquitin oligomer in each lane at reaction time 0 (zero) was 100%. (D and F) The percentage of BRAP (124–569) remaining at the end of the reaction (i.e. the non-ubiquitylated BRAP present after a 90-min reaction) was calculated by assessing the band signal intensity that corresponded to non-ubiquitylated BRAP (124–569) in each lane after a 90-min reaction, assuming that the band signal for the unshifted ubiquitin oligomer bands in each lane at reaction time 0 was 100%. (E) To assess total ubiquitylation, the intensity of the high molecular mass signals, detected in the CBB-stained gel after a 90-min reaction, was obtained, and the signals from the same area of the gel at reaction time 0 were subtracted as background. (G) To assess the production of auto-ubiquitylated BRAP, the signals detected in the high molecular mass area of the WB, after a 90-min reaction, were obtained, and the signals from the same area of the blot at reaction time 0 were subtracted as background. AU, arbitrary unit of the band signal intensity. These graphs show the average values obtained from two independent experiments.

