Fig. 3.

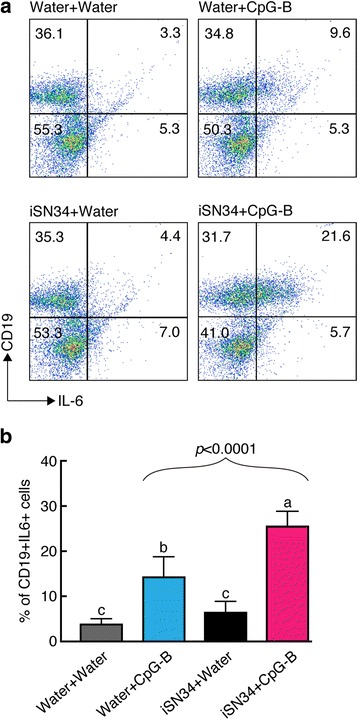
Representative flow cytometry plots. Dot plot of forward-angle versus right-angle light-scattering properties; the oval marks indicate the electronic windows used for analysis of fluorescence data for lymphocyte precursors; the rectangular boxes indicate the electronic windows used for analysis of fluorescence data for monocyte precursors with percentages. a A quadrant has been set to delineate the CD19 and IL-6 cells. Murine splenocytes were stimulated with water + water, water + CpG-B, iSN34 + water, or iSN34 + CpG-B for 12 h, and then sorted into CD19+ IL-6+ cells. b Mean percentage of IL-6+ CD19+ cells in the total population was determined in each group. Similar results were obtained from at least three different mice. Values are presented as mean + SD of three independent experiments, each performed in triplicate (n = 9). Values with different letters (i.e., a, b, c, and d) were significantly different (p < 0.01)
