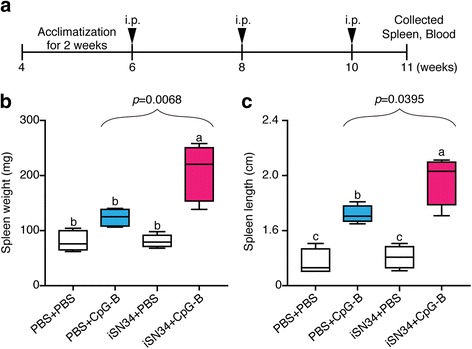
Fig. 4.

Cellular changes in spleens of mice following the in vivo trial. a Schematic design of the in vivo experiment, performed in female C57BL/6 mice. Six-week-old mice were sensitized by a total of three i.p. injections (administered once every other week) with 200 μL of PBS + PBS, PBS (100 μL) + CpG-B (100 μg), iSN34 (20 μg) + PBS, or iSN34 (20 μg) + CpG-B (100 μg). Mice were euthanized at 11 weeks of age. b Spleen weight (mg). c Spleen length (cm). Results in panels b and c are presented using box and whisker plots. The central bar in each box indicates the median, with boxes extending to the 25th and 75th percentile values; whiskers extend to the minimum and maximum values. Values with different letters (i.e., a, b, c, and d) were significantly different (p < 0.01)
