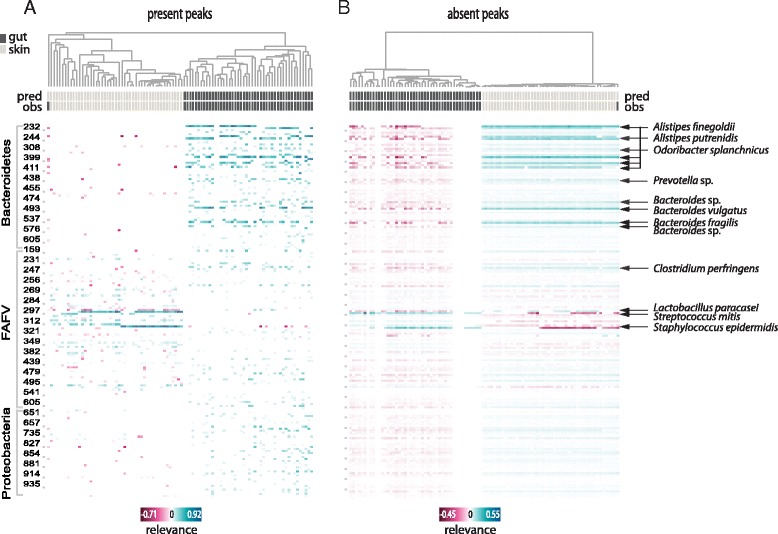
Fig. 2.

Skin microbiota vs. gut microbiota: Clustered heat maps of peaks’ relevance values across all samples. Columns correspond to samples, rows to peaks (or bacterial species). Top relevant species for classification are indicated. (a) Heat map including only the relevance calculated for positive-abundance peaks in each sample; (b) Heat map including only the relevance calculated for zero-abundance peaks in each sample. Only peaks with mean absolute relevance above 0.01 are shown in each heat map. Color key from pink to blue indicates relevance from low to high, respectively. For each sample the predicted class (pred) and the true class (obs) are indicated. Clustering is based on cosine correlation matrix followed by unweighted pair group method with arithmetic mean (UPGMA). Relevance values were calculated based on linear SVM predictions
