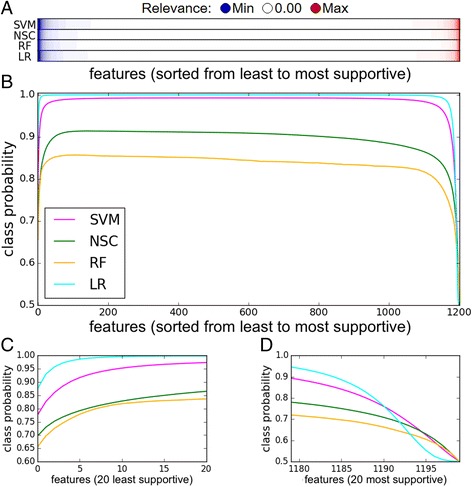
Fig. 7.

Validation of explanations: (a) Average feature relevance across all samples in the IBD dataset presented per classifier. Relevance values are sorted in ascending order, and color key from blue to red indicates relevance from low to high, respectively. (b) Validation plot: Features are sorted by relevance values and are plotted against the class probability, calculated when all features up to the current one at each point are ignored. The curve of each classifier is averaged over all samples. (c) and (d) The same curve as in (b), zoomed in on the first 20 (i.e., least support for predicted class) and last 20 (i.e., most support for the predicted class) features, respectively
