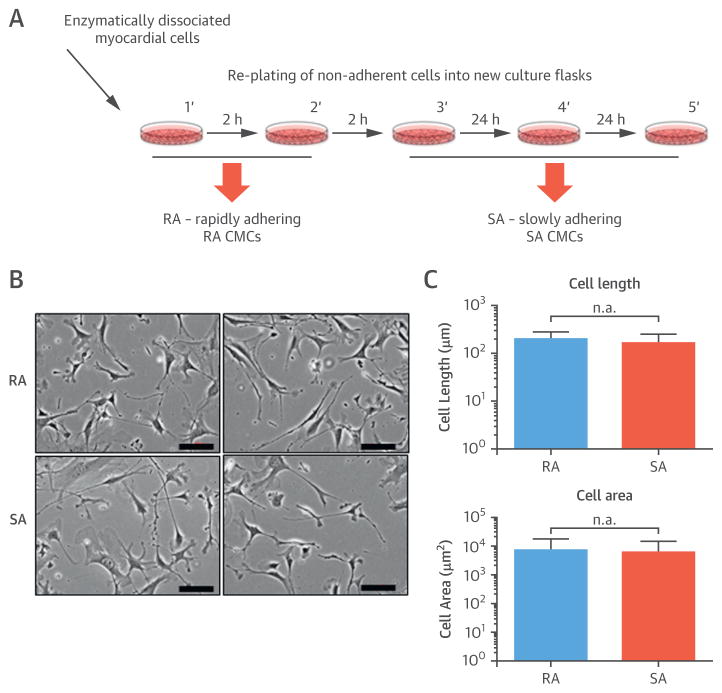
FIGURE 1. RA CMC and SA CMC Phenotype.
(A) This schematic displays the protocol for isolating rapidly adhering (RA) cardiac mesenchymal cells (CMC) and slowly adhering (SA) CMCs, shown as (B) representative images. (C) There were no significant differences in cell length or area between the groups. Values are mean ± SEM.

