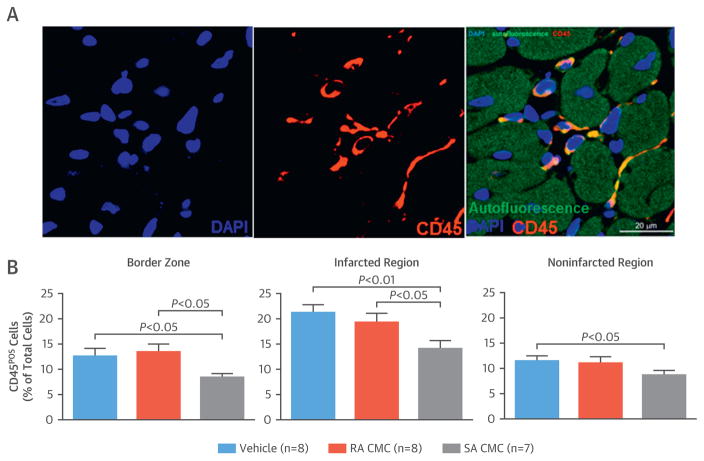
FIGURE 7. Myocardial Content of Inflammatory Cells.
(A) Representative microscopic images of left ventricular sections were stained for CD45 and deoxyribonucleic acid (with 4′,6-diamidino-2-phenylindole [DAPI]). (B) Quantitative analysis of CD45-positive cells was performed in the border zone and infarcted and noninfarcted regions of the left ventricular sections. Values are mean ± SEM. Abbreviations as in Figure 1.

