
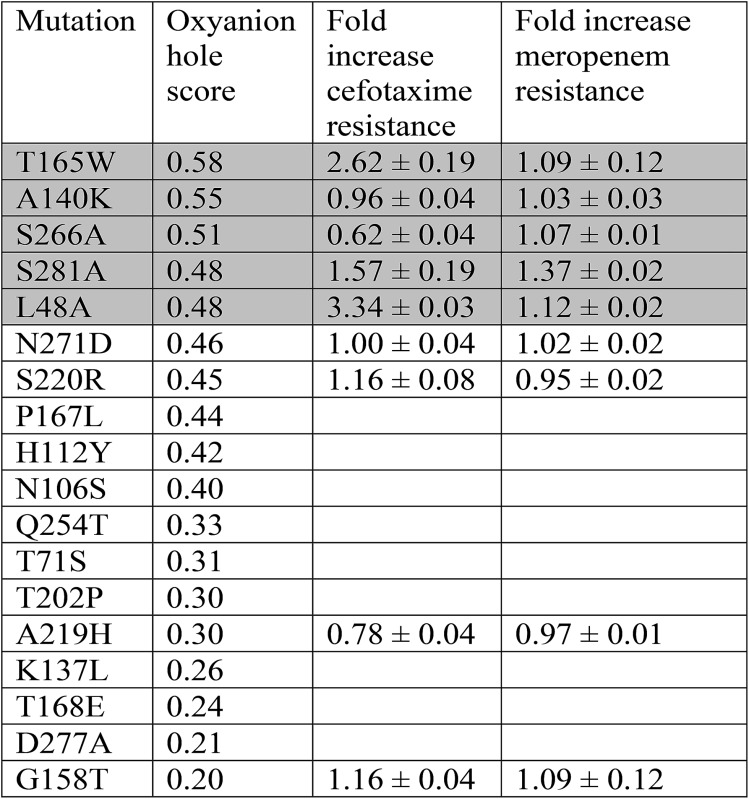
Table 1. Top CTX-M9 mutants from simulations with drug resistance measured using disc-diffusion assays. Oxyanion hole scores were computed from simulations of meropenem acylenzymes, and the top five predictions are emphasized with gray highlighting. The fold-increase in cefotaxime and meropenem resistance compared to wild-type was calculated from antibiotic disc assays. Values are reported as median fold increase in inhibitory concentration ± inter-quartile range. The three highest-resistance mutants showed no impairment in growth (Fig. S4). Oxyanion hole scores computed using cefotaxime acylenzyme simulations showed the same rank-ordering of top mutants and are included in Table S1.
|