. 2017 Jul 6;8(9):6380–6388. doi: 10.1039/c7sc02340e

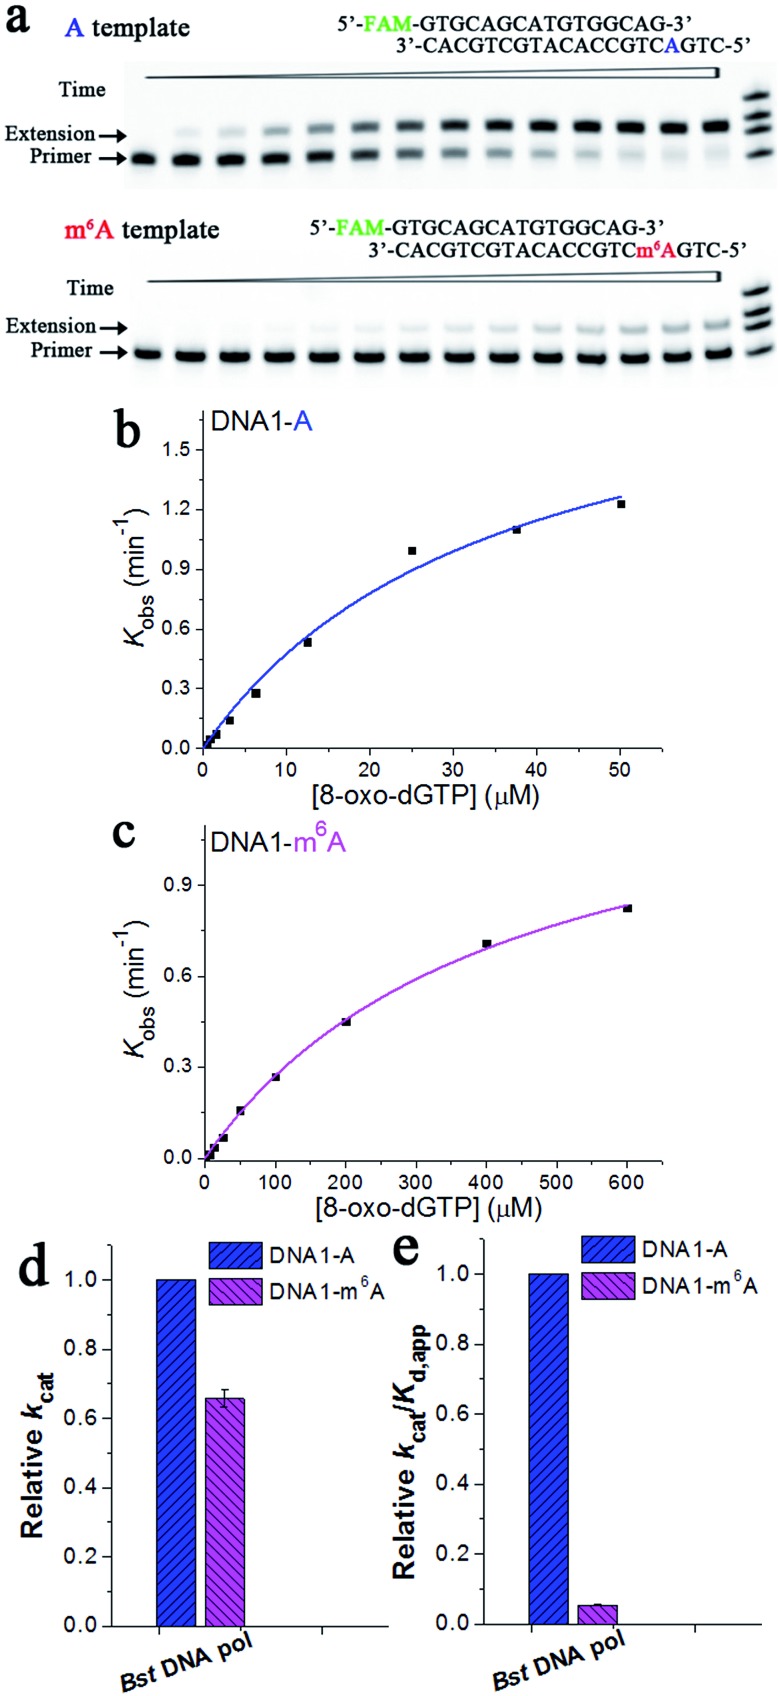
Fig. 7. Pre-steady-state kinetics of the 8-oxo-dGTP incorporation by Bst DNA pol. (a) Images of representative gels are shown here. Time points are 0, 0.5 min, 1.0 min, 2.0 min, 3.0 min, 4.5 min, 6 min, 8 min, 10 min, 13 min, 16 min, 20 min, 25 min, and 30 min (left to right). Reactions were carried out as described in the ‘Materials and methods’ section using 50 nM primer/template duplex and 3.125 μM 8-oxo-dGTP. The oligonucleotides (primer1, primer1 + 1, primer1 + 2, and primer1 + 3) were used as size markers. (b) and (c) show representative kinetic fitting curves of the 8-oxo-dGTP incorporation opposite m6A or A in the DNA template. The 17-nt product was plotted as a function of time and fit to eqn (1) to obtain the reaction rate k obs. The dependence of k obs on the 8-oxo-dGTP concentration was fit to eqn (2) in order to obtain k cat and K d,app. (d) and (e) show the relative kinetic constants (k cat or k cat/K d,app) of Bst DNA pol for the incorporation of 8-oxo-dGTP opposite DNA m6A relative to A. All of the kinetic constants are summarized in Table 1.

Fig. 7