
Figure 3.
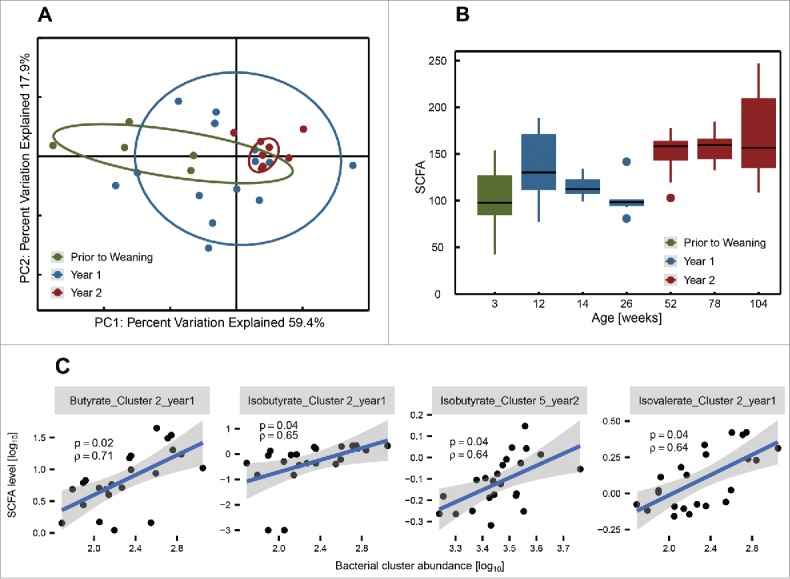
Fecal SCFA-levels in rats are associated with age and microbiota composition. (A) Principle coordinates analysis of the Spearman-rank distance and (B) boxplots of fecal SCFA levels reveal different SCFA profiles across the lifespan of the animals. Age groups and colors as in Figure 1. (C) The levels of several SCFAs were correlated with total abundance of bacterial clusters (Fig. 1B). The title of each panel indicates which SCFA was compared with which bacterial cluster and from which age group the samples were drawn. Blue lines indicate the linear regression model and shaded areas indicate the corresponding upper and lower confidence intervals. ρ = Spearman's rho. p = adjusted p-value (Benjamini-Hochberg). Only significant correlations shown. The hinges of the boxes in the box-and-whisker plots represent the 25th to 75th percentile with the 50th percentile (median) drawn as the line inside the box. Whiskers extend to 1.5 times the interquartile range.