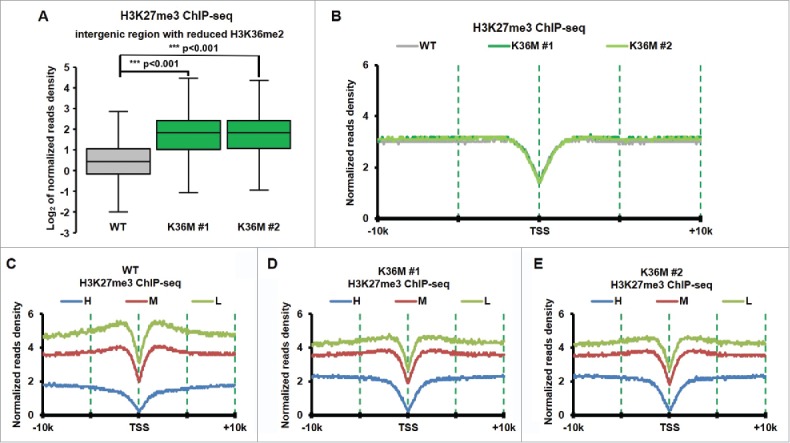
Figure 4.

H3K27me3 increased dramatically at intergenic regions with reduced of H3K36me2 in H3.3K36M cell compare with WT cell. (A) Normalized tag distribution profiles of H3K27me3 for intergenic regions with reduced H3K36me2 in 2 H3.3K36M mutant cell lines compare with WT cells. The reads are normalized to reads per kilobase per 10 million mapped reads. (B) The normalized reads density of H3K27me3 ChIP-Seq was plotted from 10 kb upstream to 10Kb downstream from TSS sites in WT and H3.3K36M cells. The reads are normalized to reads per kilobase per 10 million mapped reads. (C-E) The same calculation as in B, but the whole human genes were split into equal number of 3 groups according to their expression levels. H: high expression, M: medium expression, and L: Low expression.
