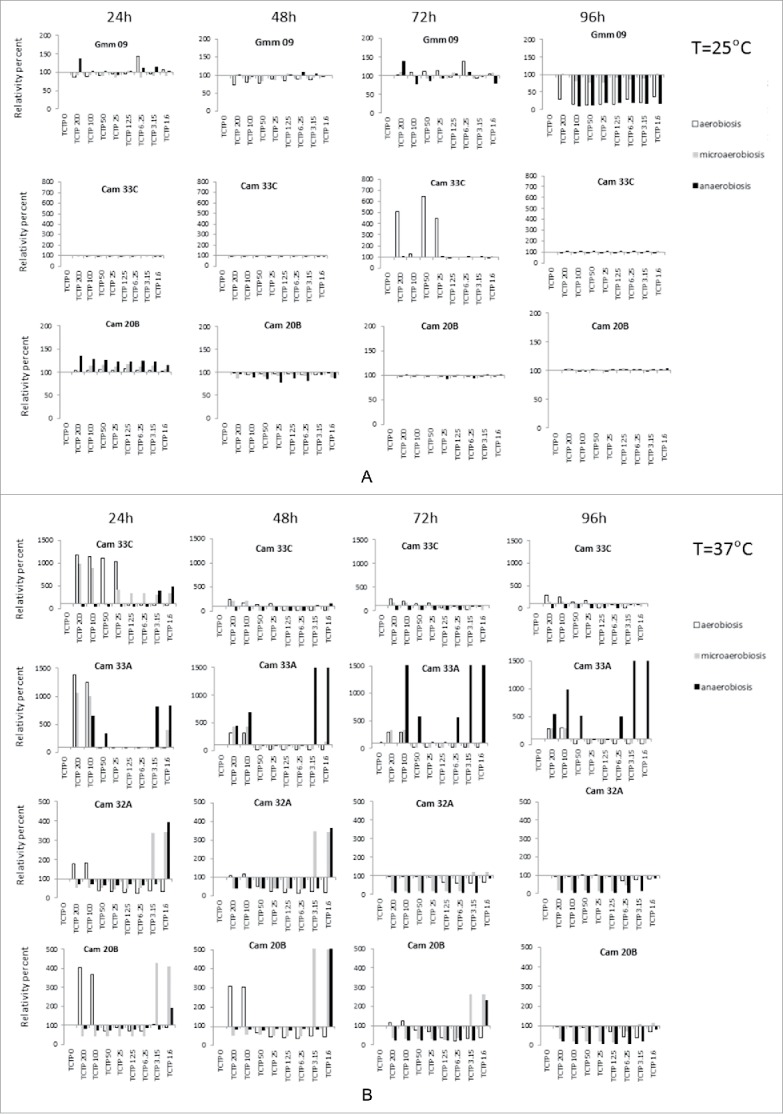
Figure 6.

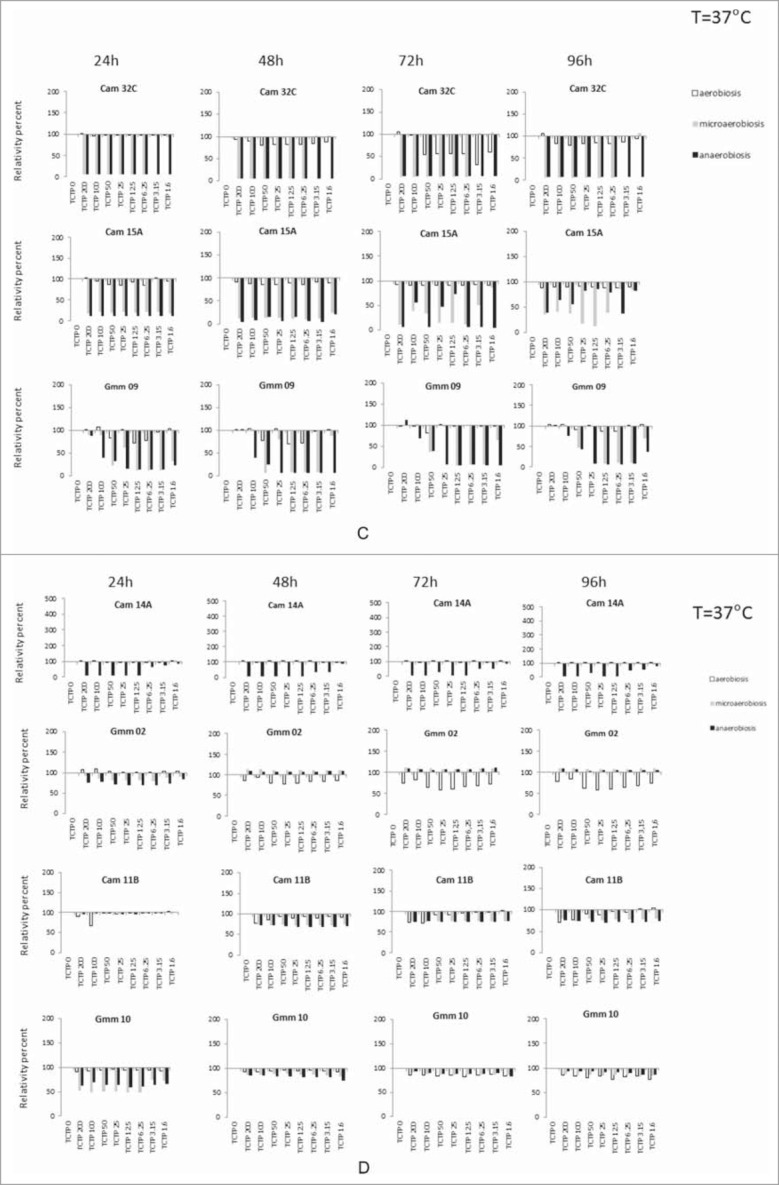
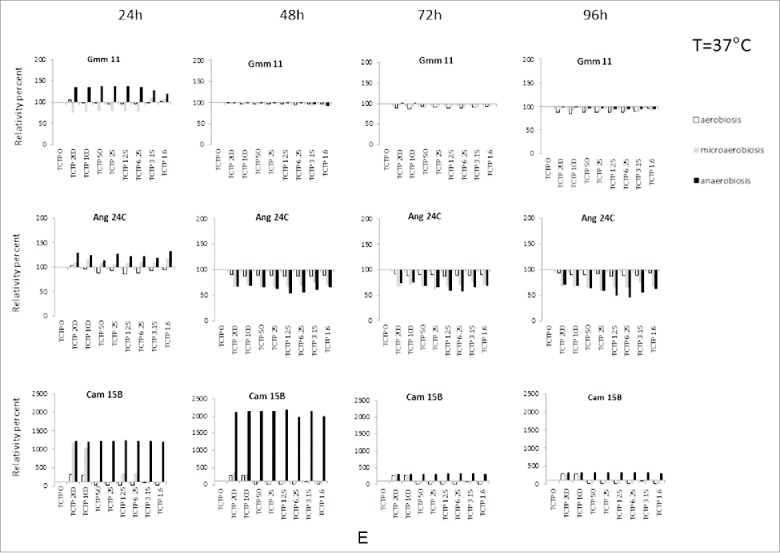
Effect of different concentrations of rTbgTCTP on bacteria growth. The effect was tested at 25°C (A) and 37°C (B-E), under 3 different atmosphere compositions: aerobiosis (white column), microaerobiosis (gray column), and anaerobiosis (black column). Histograms compare, for a given experimental condition (and for each time), the OD of the tested culture (with TCTP at a given concentration) with the OD of the corresponding control culture without TCTP (assigned to the value 100%). The results are the mean of triplicate experiments.
Figure 6.

(Continued).
Figure 6.

(Continued).
