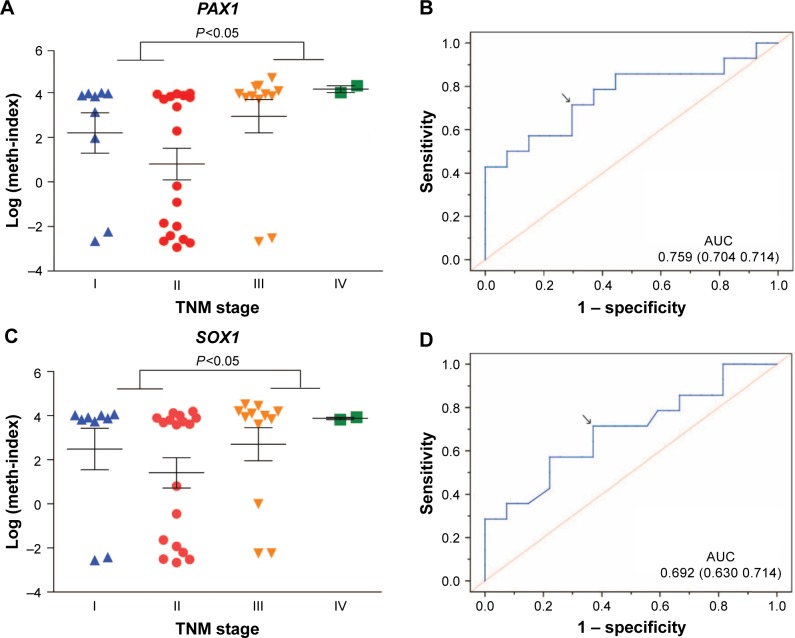
Figure 3.
Methylation distribution of CRC tissues at various TNM stages.
Notes: (A) Dot plots illustrate the log (meth-index) distributions of PAX1 gene at various TNM stages. (B) The AUC of ROC curve was calculated to diagnose the TNM stage I/II and stage III/IV for PAX1. (C) Dot plots illustrate the log (meth-index) distributions of SOX1 gene at various TNM stages. (D) The AUC of ROC curve was calculated to diagnose the TNM stage I/II and stage III/IV for SOX1 gene. P<0.05 was determined by Mann–Whitney U-test. Arrows show the best specificity and sensitivity.
Abbreviations: AUC, areas under the curve; CRC, colorectal cancer; PAX1, paired boxed gene 1; ROC, receiver-operating characteristic; SOX1, sex-determining region Y-related high-mobility group box 1.

