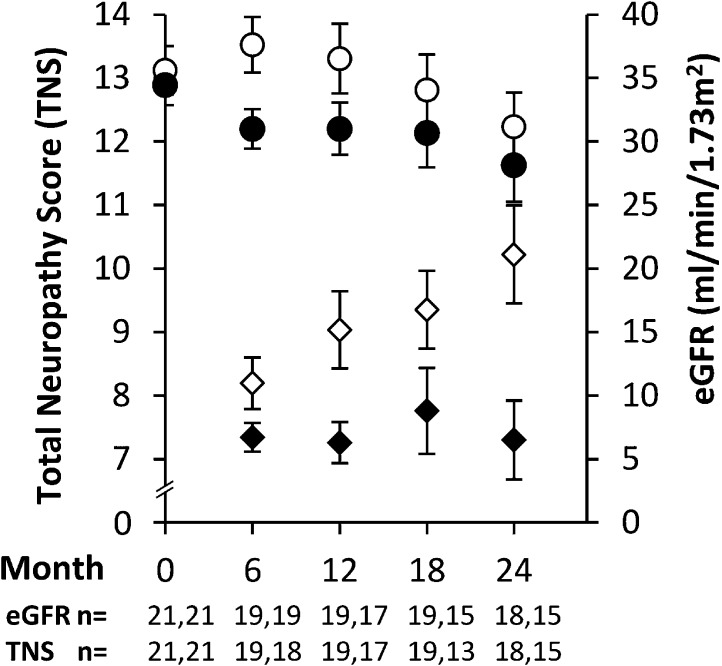
Figure 3.
In a randomized, controlled trial of dietary potassium restriction over 2 years, the intervention group showed stable neuropathy scores (black diamonds), whereas the control group showed a progressive increase in neuropathy severity (white diamonds). These changes occurred in the presence of a progressive decline in eGFR that was comparable between groups (control, white circles; intervention, black circles). Neuropathy values are mean total neuropathy scores (±SEM) adjusted for the baseline value. The circles are unadjusted mean eGFR values (±SEM) obtained at 6-month intervals. The numbers analyzed at each time point are stated below the x axis as control and intervention, respectively.

