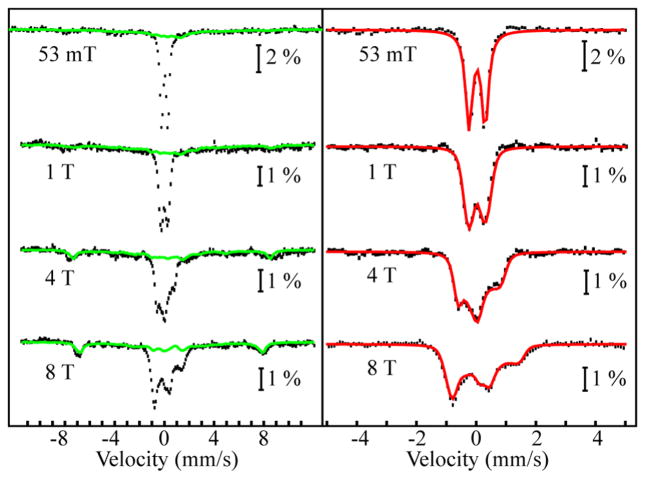
Figure 2.
4.2 K Mössbauer spectra of 1-O. Left panel: Spectra recorded in externally applied magnetic field with field strength indicated in the figure (black vertical lines). The solid green lines are the experimental spectra of a duplicate sample of 1 + IBX-ester reacted at 23 °C for 40 min, scaled to 38% of intensity. Right panel: Reference spectra of 1-O generated by removal of the contribution of the decay products (black vertical lines). The solid red lines are simulations for S = 1 spin Hamiltonian using the following parameters: D = 23 cm−1, E/D = 0.08, giso = 2.0, δ = 0.03 mm/s, ΔEQ = +0.54 mm/s, η = 0, and A = (−29.1, −27.8, −6.5) MHz.

