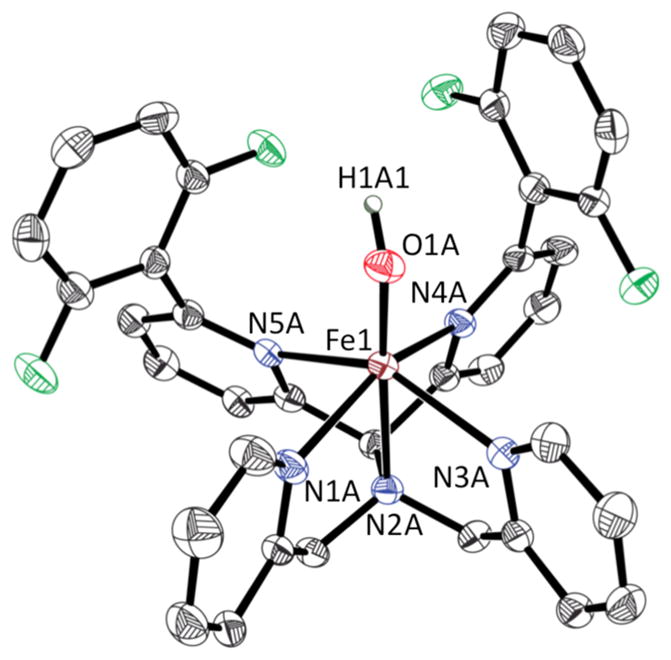
Figure 9.

Displacement ellipsoid plot (50% probability) of one of the two crystallographically independent cations of 4 at 110(2) K. All H atoms were omitted for clarity (except for H1A1). Selected bond distances (in Å) for one of the crystallographically independent units: Fe1–N1A 2.175(4), Fe1–N2A 2.269(4), Fe1–N3A 2.223(4), Fe1– N4A 2.251(4), Fe1–N5A 2.300(4), Fe1–O1A 1.914(3).
