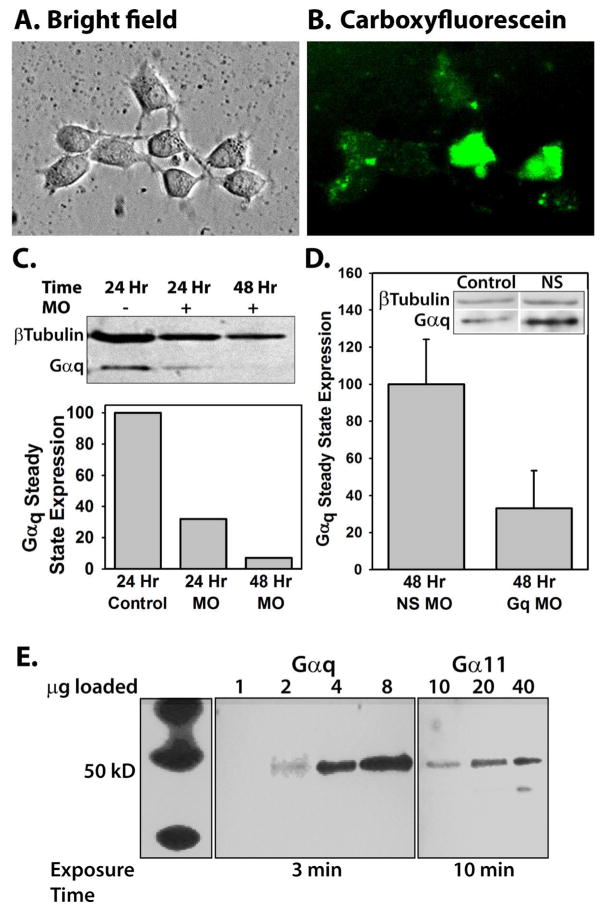
Fig. 1.
A) Differential interference contrast image of a hippocampal culture from a postnatal day 4 rat pup treated with 10 μM control morpholino oligos and 2 μM Endo-Porter peptide, and maintained in culture for 96 hours. B) Fluorescent image of A; oligos were tagged with carboxyfluorescein for visualization. C) Western blot of proteins isolated from either a control culture (lane 1), a culture treated for 24 hours (lane 2) or 48 hours (lane 3) with 2 μM Gαq oligos. Protein bands were visualized with Gαq antibodies and β-tubulin antibodies as a loading control. Gαq band densities were calculated by dividing the integrated optical density of the Gαq band by the integrated optical density of the β tubulin band to control for loading and expressed as percent of control. D) Western blot analysis of 6 different preparations from cultured neurons treated for 48 hours with nonsense oligos (N=3, NS MO) or Gαq oligos (N=3, Gq MO). The data were analyzed as in C, with the average of the nonsense oligo treated preparations defined as 100%. Data are expressed as mean±SEM. The inset is an example of Gαq expression in control tissue compared to cells treated with nonsense morpholinos to demonstrate that the nonsense morpholinos do not cause nonspecific knockdown of Gαq. E) Western blot analysis of Gαq and Gα11 G-protein in the neonatal hippocampus. Analysis was performed using tissue from the superior region of the hippocampus and antibodies against either Gαq or Gα11 proteins. The left panel shows molecular weight markers (same experiment but exposed to film for 1 sec). To visualize bands labeled with Gα11 antibody, 10 times more protein was loaded (right panel) than for lanes labeled with Gαq antibodies (center panel) and the exposure time was increased to 10 minutes, compared with 3 minute exposure for bands labeled with Gαq antibodies.

