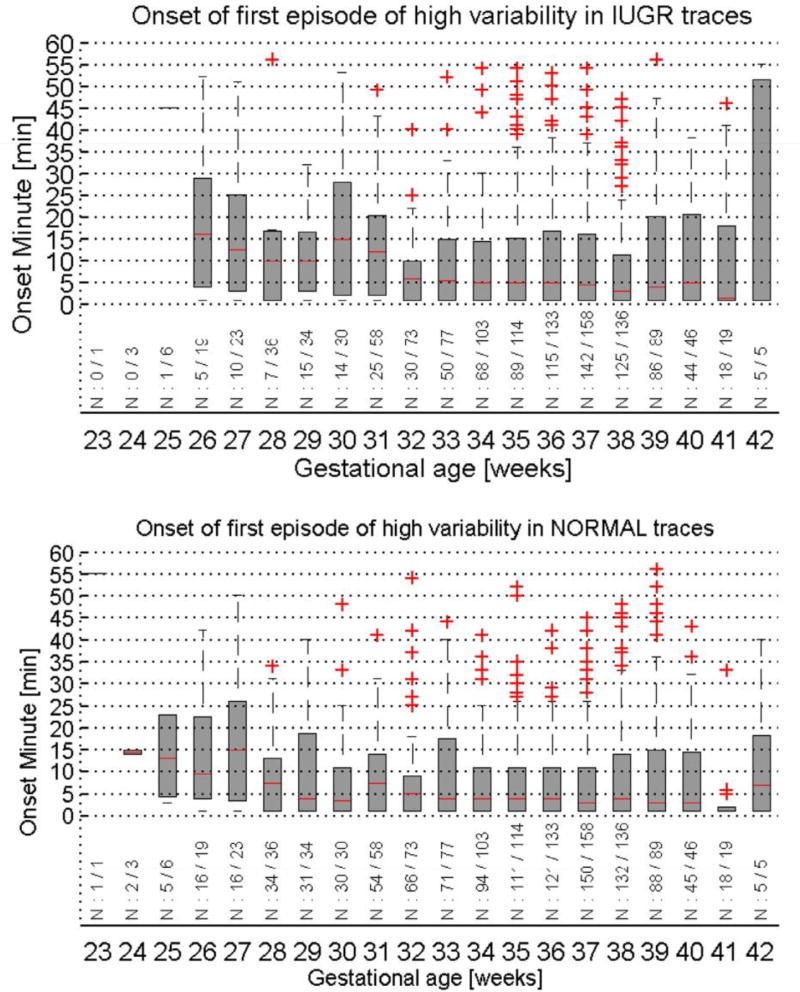
Figure 3.
The median and interquartile range of the onset time of the first episode of high heart rate variation in recorded traces (top: IUGR traces, bottom: healthy controls). Box plots are shown per gestational age, below each boxplot the number of traces with a high variation episode out of the total number of traces for the gestational age group is indicated.

