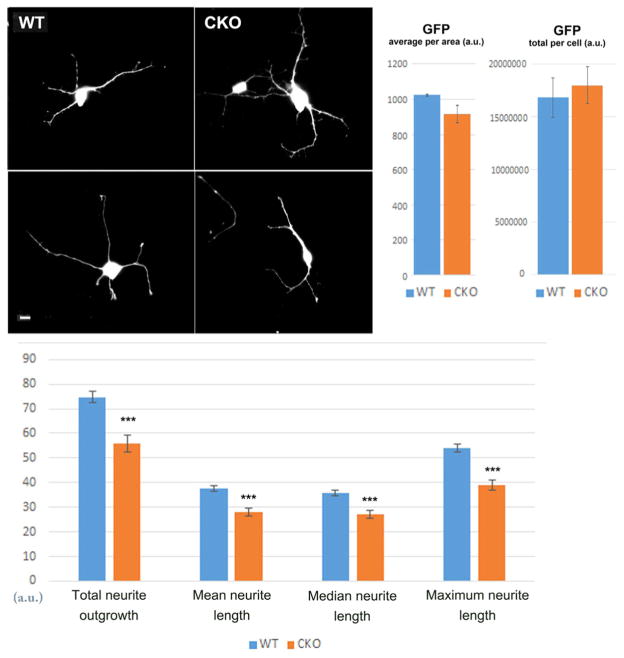
Fig. 3. Ate1 knockout neurons exhibit reduced neurite outgrowth.
Top, representative images of GFP-transfected wild type (WT) and Nes-Ate1 (CKO) cultured primary hippocampal neurons (left) and quantification of average and total GFP fluorescence per area (right). Scale bar, 20 μm. Bottom, quantification of neurite outgrowth from the images similar to those shown on top, using Metamorph Imaging Software. Error bars represent SEM, n = 401 neurites (WT) and 1608 neurites (CKO), quantified from 66 images of neuron cultures derived from 2 embryos for WT and 214 images derived from 4 embryos in CKO. *** indicates P value < 0.000003, determined by 2-tailed unpaired t-test.

