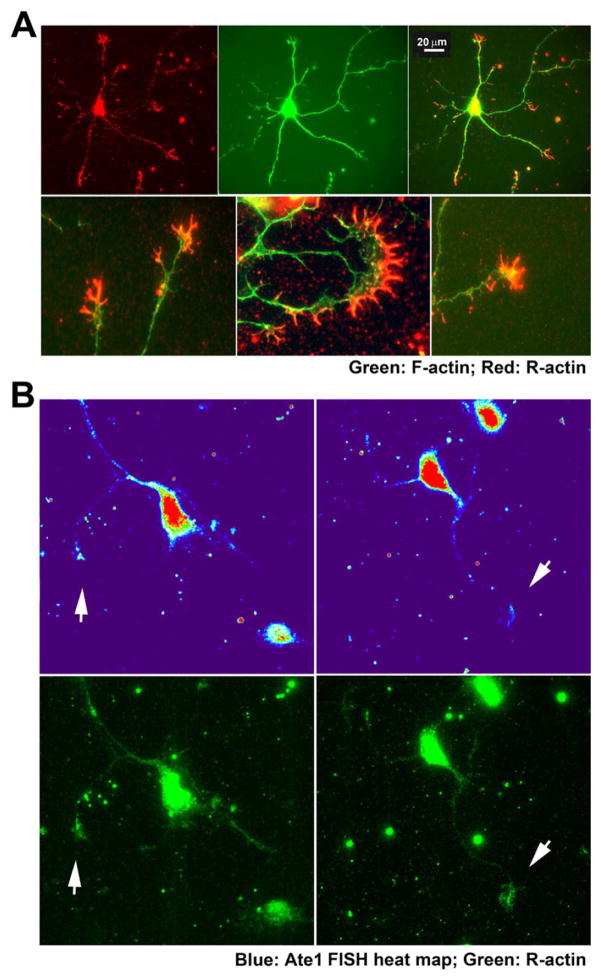
Fig. 6. Arginylated β-actin and Ate1 mRNA co-localize at the tips of the growth cones.
A, Representative images of primary cultured wild type mouse hippocampal neurons double-stained with antibodies to arginylated β-actin (red) and F-actin (stained with phalloidin-Alexa 488, green). The bottom row shows enlarged views of growth cones. B, Representative images of the neurons showing the heat map of Ate1 mRNA FISH signal (top) and staining with antibodies against arginylated β-actin (bottom). Arrows indicate points of colocalization of the two signals at the growth cones. Scale bar, 20 μm.

