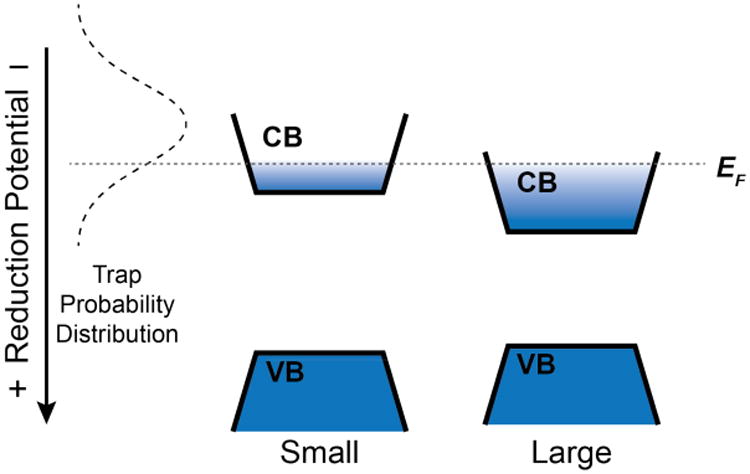
Figure 7.

Schematic depiction of the proposed relationship between a trap potential's probability distribution and the photodoping characteristics of colloidal CdSe NCs. The dashed Gaussian curve depicts the probability distribution of a single trap's potential, which fluctuates stochastically relative to the CB edge. Within this distribution, a trap has a discrete relative potential for a period of time before hopping to another relative potential. Sampling of the full potential distribution is slow and thermally activated. The dotted horizontal line indicates the Fermi level achieved via photodoping. When the trap hops to a potential below the Fermi level, electron transfer from the CB to the trap is favorable. Under steady-state excitation conditions, the photodoping rate equals the electron-trapping rate. Increasing quantum confinement shifts the CB edge to more negative potentials, increasing the probability of thermodynamically favorable electron trapping at a given value of <n>, yielding a smaller value of <nmax>. A similar schematic applies to nanocrystal redox-potential shifting via surface non-stoichiometries. Surface perturbations likely also affect the total number of fluctuating trap states per NC, which in turn affects photodoping and electron decay, but these considerations are not depicted here.
