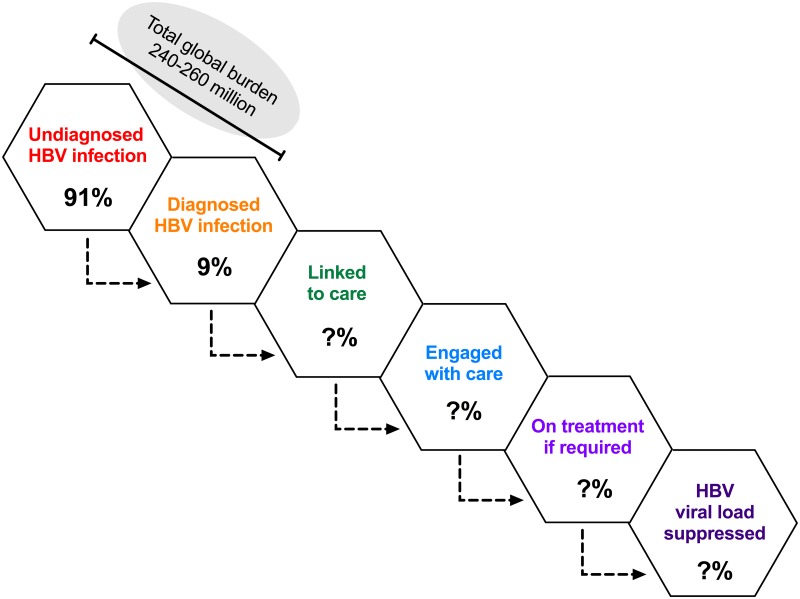
Fig 1. The hepatitis B virus (HBV) cascade.
Diagrammatic representation of the total burden of HBV infection and the subsets of individuals who are diagnosed (orange), linked to care (green), engaged with care (blue), on treatment (light purple), and have suppressed viremia (dark purple). An estimate of the proportion of cases undiagnosed versus diagnosed (91% versus 9%, respectively) is based on the WHO fact sheet [3]. The proportion who flow from each pool to the next is otherwise represented by a question mark, as these numbers are not represented by robust data.

