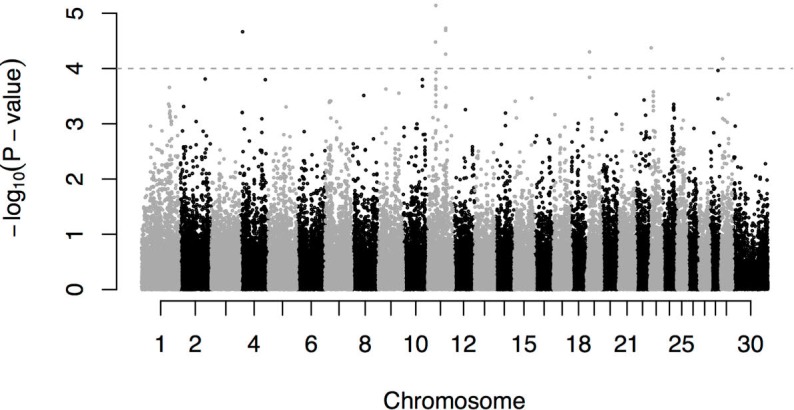
Fig 5. Association between individual SNP and milk yield from a genome-wide association study.

Each dot represents a SNP that has passed the quality threshold and the high above the X axis is proportional to the strength of the association.

Each dot represents a SNP that has passed the quality threshold and the high above the X axis is proportional to the strength of the association.