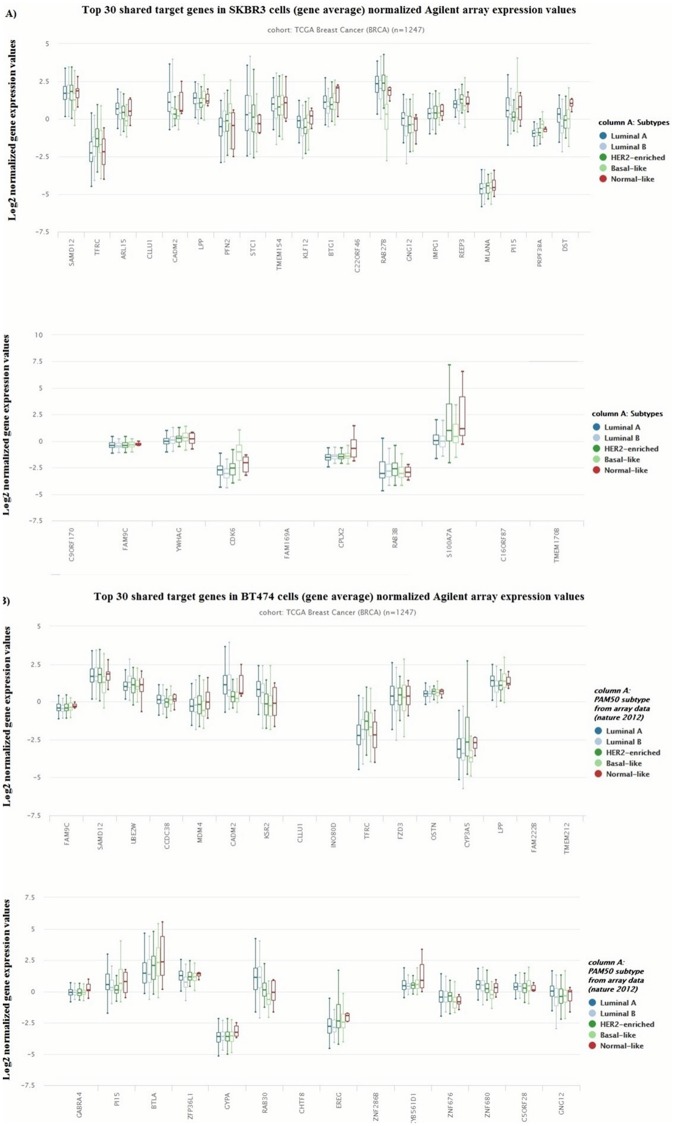
Fig 2. The expression values of top 30 targeted genes in the network in TCGA breast cancer data.
(A-B) TCGA breast invasive carcinoma (BRCA) gene expression (AgilentG4502A_07_3 array) was obtained by using 1247 samples in total. The expression values of the genes were given according to molecular subtypes of breast cancer (Luminal A, Luminal B, HER2+, Basal Like and normal like). The expression levels were indicated as in log2 lowess normalized ratio of sample signal to reference signal (cy5/cy3) collapsed for each gene. In order to view the differential expression between samples more easily, the default view was set to center each gene or exon to zero by independently subtracting the mean of each gene or exon on the fly. The data sets were visualized by using Xena Browser.

