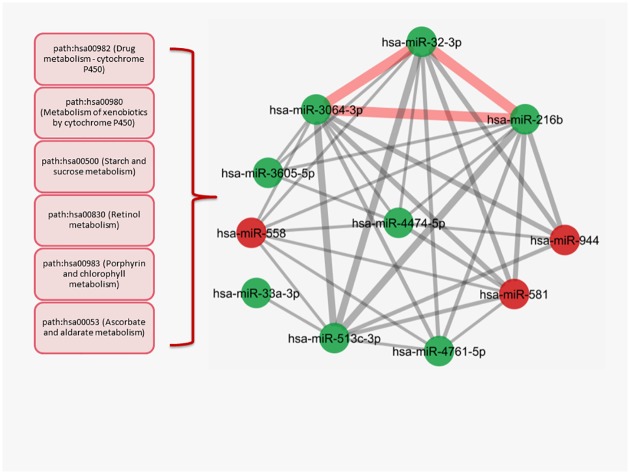
Fig 5. The largest cluster in the BT474 miRNA-miRNA network.
The most powerful interaction consisted of the thick edges presented as a triangle (red) between hsa-miR-3064-3p, hsa-miR-32-3p and hsa-miR-216b. The edges are comprised of the metabolic pathways that also dominate the interactions between the other nodes in the complete cluster. The aforementioned pathways were shown in red boxes in left side. (The edge weight minimum value = 2.9, P<0.05 for each miRNA pair, red nodes:upregulated miRNAs, green nodes: downregulated miRNAs).

