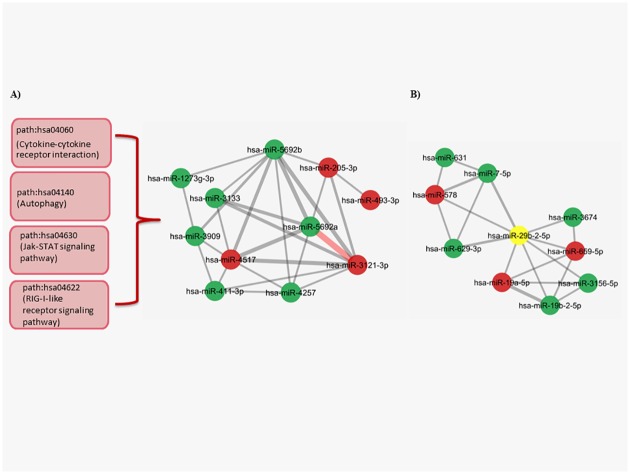
Fig 6. The second and third largest clusters in the BT474 miRNA-miRNA network.
(A) The most powerful interaction consisted of one thick edge (red) presented between hsa-miR-5692a and hsa-miR-3121-3p. The edges are made of the cancer related pathways that control majority of the interactions between the other nodes in the complete cluster. The aforementioned pathways are shown in red boxes in left side. (B) In the last cluster, hsa-miR-29b-2-5p (shown in yellow) has important role as a hub node to unite two different groups of miRNAs that enriched in path:hsa05220 (Chronic myeloid leukemia), path:hsa04010 (MAPK signaling pathway) and path:hsa04060 (Cytokine-cytokine receptor interaction), path:hsa04630 (Jak-STAT signaling pathway) pathways (The edge weight minumum value = 2.9, P<0.05 for each miRNA pair, red nodes:upregulated miRNAs, green nodes: downregulated miRNAs).

