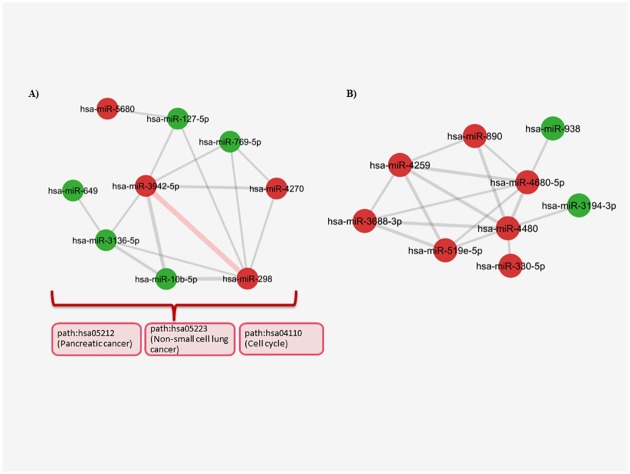
Fig 8. The second and third largest clusters in the SKBR3 miRNA-miRNA network.
(A) The most powerful interaction is consisted of one thick edge (red) presented between hsa-miR-3942-5p and hsa-miR-298. The edges are made of the cancer related pathways that control majority of the interactions between the other nodes in the cluster. The afermentioned pathways are shown in red boxes in left side. (B) In the last cluster, the interactions are determined by the upregulated miRNAs mostly and they are related to each other through path:hsa04810 (Regulation of actin cytoskeleton) and path:hsa05200 (pathways in cancer) (The edge weight minumum value = 2.9, P<0.05 for each miRNA pair, red nodes:upregulated miRNAs, green nodes: downregulated miRNAs).

