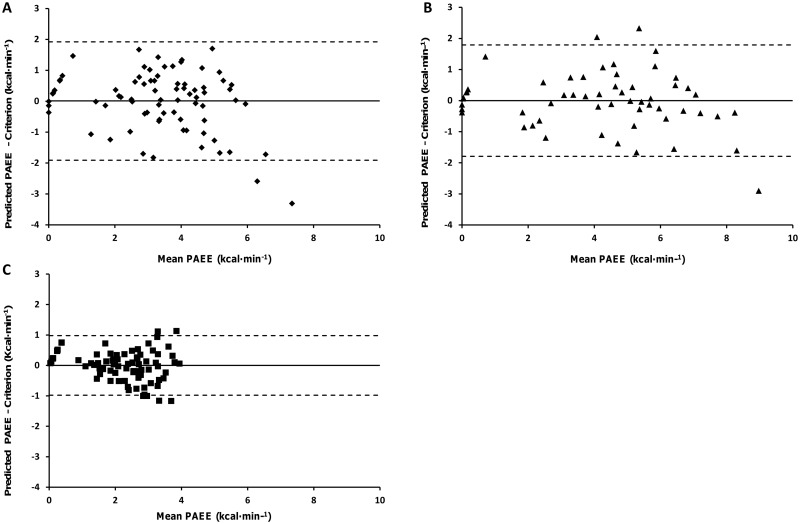
Fig 2. Bland and Altman plots for the criterion and predicted PAEE using cross-validated, population specific prediction models (Model 2).
Developed for the unilateral group (A), bilateral group (B) and control group (C). The straight line demonstrates the mean and the dotted line indicates the 95% Limits of Agreement (LoA).

