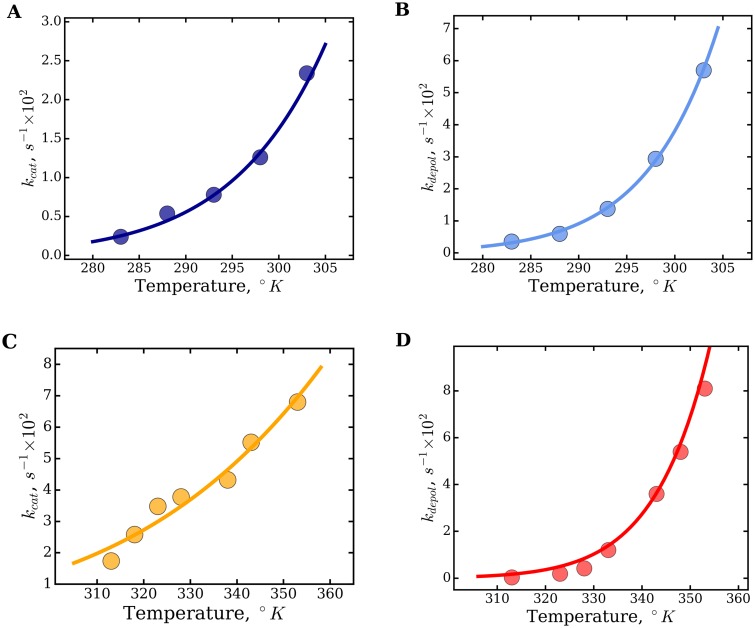
Fig 4. Eyring plots of the GTPase activity and polymerization of FtsZ.
Top row, mesophilic EcFtsZ. Bottom row, thermophilic MjFtsZ. The kinetic rates of GTP hydrolysis, kcat (A and C), and filament depolymerization, kdepol (B and D), are plotted as a function of temperature. The apparent enthalpies (ΔH0‡) and entropies (ΔS0‡) of the transition state were calculated by nonlinear regression using Eq 4 (solid lines), and the best-fit values are reported in Table 3.

