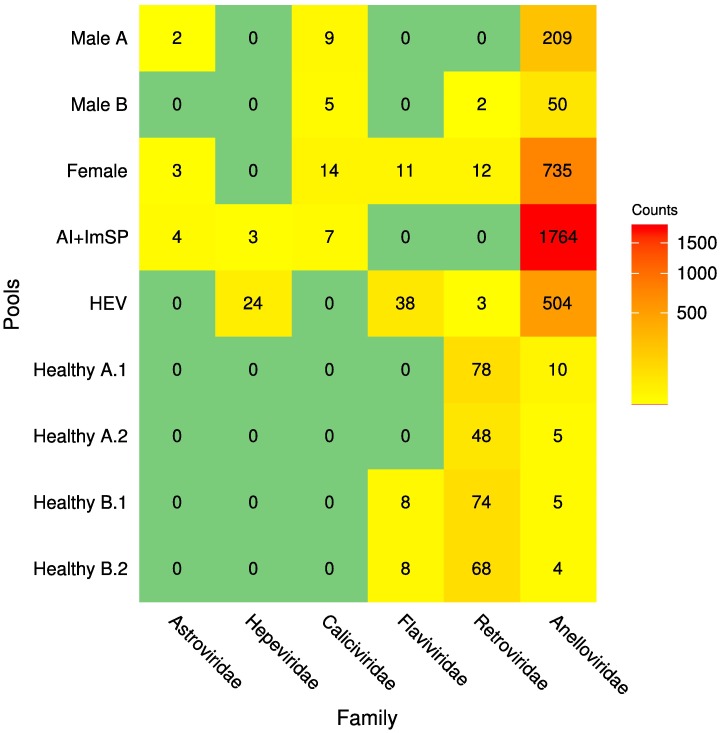
Fig 1. Heatmap describing number of contigs identified in each pool after their characterization and classification into taxonomic groups.
Rows correspond to pooled samples whilst columns to families mapped at least to one sample. Numbers within each cell represent the number of sequences that had at least a positive BLAST hit to into known species and passed all the selection criteria. The colours range from yellow to red (low to high abundance respectively); green means that sequences were not detected for that group.

