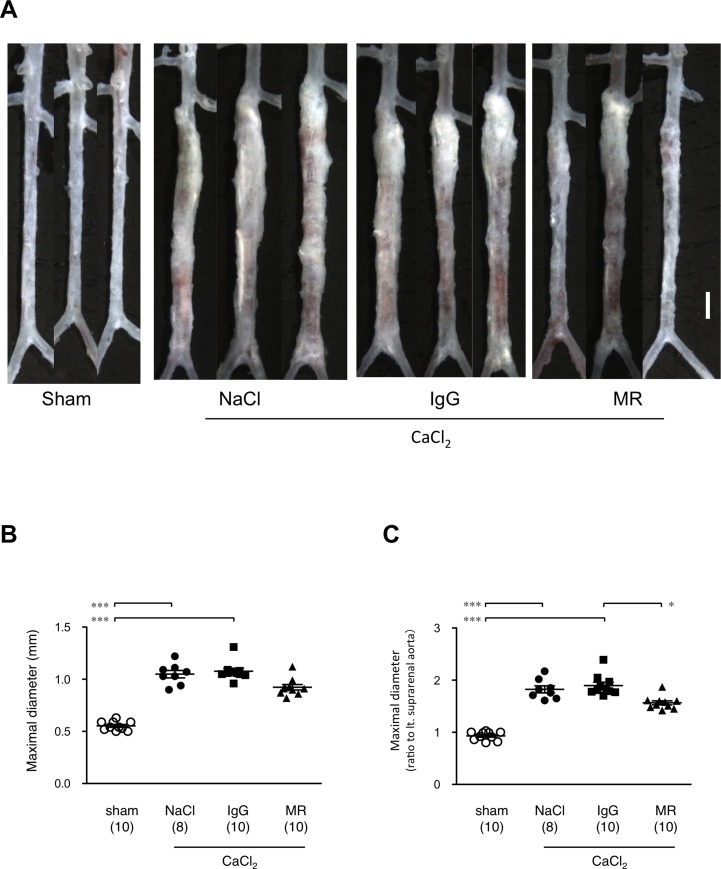
Fig 1. The effect of MR16-1 on the development of AAA.
(A) Morphometric analyses of mouse AAA, (B) maximal aortic diameters in millimeters, and (C) relative to an internal reference diameter at the level of the left renal artery. In panel A, CaCl2 indicates the AAA model 6 weeks after CaCl2 exposure. NaCl and IgG indicate the AAA model treated with physiological saline and non-specific rat IgG, respectively, as negative controls for MR16-1 (denoted MR). The white bar denotes 1 mm. In panels B and C, symbols indicate individual data and bars indicate means ± standard errors. The numbers of mice for observation are indicated in parenthesis. *p< 0.05 and ***p<0.001.

