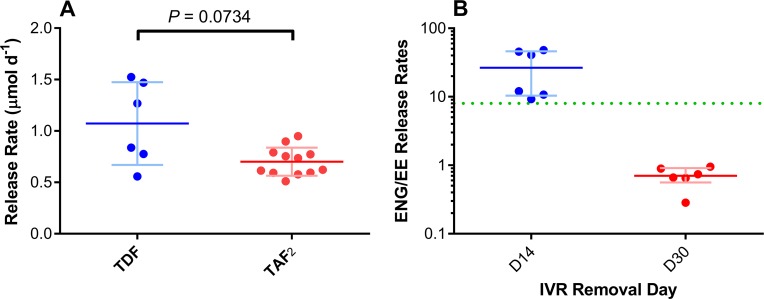
Fig 4. In vivo IVR drug release rates in the context of previous studies.
(A) Molar daily in vivo release of TDF from a previous pod-IVR study in pigtailed macaques [39] compared to TAF2 release rate in the present study. An unpaired t test with Welch’s correction shows that while the release rates are not statistically significantly different (P = 0.0734), they are similar, with the mean TAF2 release rate (red horizontal bar) being lower than the mean TDF release rate (blue horizontal bar) from the TDF-FTC pod-IVRs. Each circle corresponds to an individual datum; pale error bars correspond to standard deviations from the mean. (B) Paired ENG:EE in vivo release rate ratios for Configuration A (blue) and Configuration B (red) pod-IVRs. The ratios span the in vivo ENG:EE release rate ratio for the NuvaRing® in women (green broken horizontal line). Each circle corresponds to an individual datum; horizontal lines, means; pale error bars, standard deviations from the mean.

