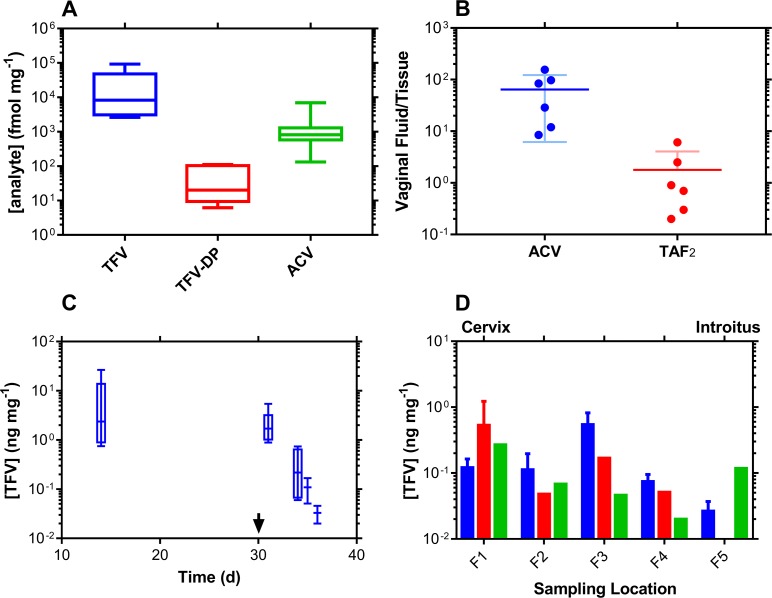
Fig 6. In vivo (N = 6) vaginal tissue homogenate drug levels from Configuration A and Configuration B TAF2-ACV-ENG-EE pod-IVRs.
(A) Box plots of Day 14 (Configuration A) vaginal tissue molar concentrations at pod-IVR removal. The box extends from the 25th to 75th percentiles, with the horizontal line in the box representing the median; whiskers represent the lowest and highest datum. Vaginal tissue biopsies were collected distally to the pod-IVRs. Molar concentration units (fmol mg-1) were used on the y-axis to allow direct comparison between analytes. (B) Paired vaginal fluid:vaginal tissue concentration ratios of TFV (delivered as TAF2) and ACV at Day 14. The ratios provide a measure of the extent of tissue penetration for each analyte following vaginal delivery and, hence, vaginal bioavailability. (C) Box plots representing TFV washout from vaginal tissues following pod-IVR removal on Day 30 (arrow). The box extends from the 25th to 75th percentiles, with the horizontal line in the box representing the median; whiskers represent the lowest and highest datum. Vaginal tissue biopsies were collected on Day 14 and Day 31distally to the pod-IVRs. For Day 34–36 samples, collected at necropsy, only vaginal tissue TFV concentrations at locations F3 and F4 (see panel D) were used in the analysis to maintain consistency is sampling location (i.e., distal to the pod-IVRs). The median terminal half-life of TFV in vaginal tissues was found to be 18 h (IQR, 13–30 h). (D) Longitudinal distribution of TFV concentrations in whole vaginal tracts collected at necropsy (Day 34–36), i.e., following removal of the second set of IVRs. The vaginal tracts were divided into uniform segments (F1-F5) spanning from the cervix (F1, proximal to the IVR) to the introitus (F5) and the homogenized sections analyzed for TFV concentrations. Blue, Day 34 (N = 2); red, Day 35 (N = 2); and green, Day 36 (N = 2).

