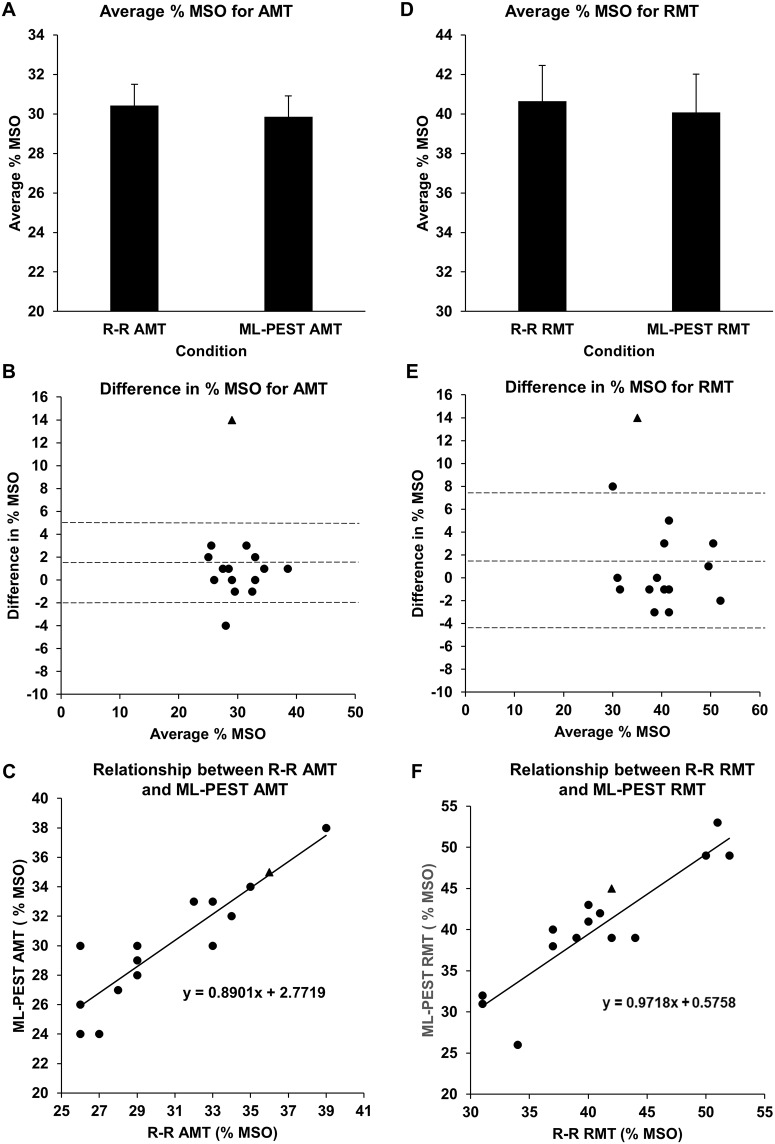
Fig 1. Comparison of RR and ML-PEST approach.
(A) Comparison of the mean MSO using different testing conditions: the group-averaged MSO obtained for R-RAMT and ML-PESTAMT demonstrating no significant difference. (B) Limits of agreement between R-RAMT and ML-PESTAMT using a Bland-Altman plot demonstrating good agreement with optimal analysis for these data. (C) Scatter plot demonstrating relationship between R-RAMT and ML-PESTAMT also confirming similarities between estimation tools. (D) Comparison of the mean MSO using different testing conditions: the group-averaged MSO obtained for R-RRMT and ML-PESTRMT demonstrating no significant difference. (E) Limits of agreement between R-RRMT and ML-PESTRMT using a Bland-Altman plot demonstrating good agreement with optimal analysis for these data. (F) Scatter plot demonstrating relationship between R-RRMT and ML-PESTRMT also confirming similarities between estimation tools. Data from participant 12, shown with a triangle, was not included in any statistical analyses.

