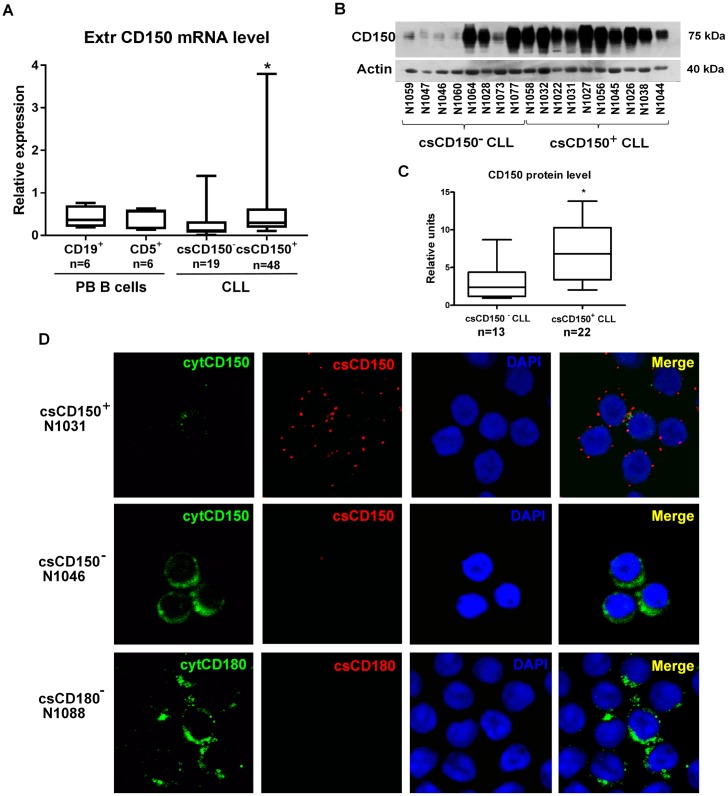
Fig 2. CD150 expression and topology in CLL B cells.
(A) Total CD150 mRNA expression levels in normal peripheral blood CD19+ and CD5+ B cells, csCD150- and csCD150+ CLL cases. Results of qRT-PCR analyses using primers specific for the region encoding the CD150 extracellular domain. Expression of CD150 was normalized to TBP expression level. Box plots showed quartiles, median, minimum and maximum values. * p = 0.01 compared to csCD150- CLL cases. (B) Western blot analysis of CD150 expression in csCD150- and csCD150+ CLL samples using a rabbit anti-CD150 mAb. One of three experiments is presented. (C) Densitometry analysis of CD150 protein expression in CLL cases. Results were normalized to actin expression. CD150 protein expression was detected in all csCD150- CLL samples, but on significantly lower level than in csCD150+ CLL samples. * p = 0.05 compared to csCD150- CLL cases. (D) Differential cell surface (cs) and cytoplasmic CD150 and CD180 expression in CLL B cells. Live cells were incubated with primary anti-CD150 or anti-CD180 mAbs followed by secondary Alexa Fluor 594 (red) goat anti-mouse antibody and fixation/permeabilization. Then samples were incubated with FITC conjugated anti-CD150 mAb (green) and DAPI was added for DNA staining. In csCD150+CLL samples CD150 was predominantly expressed on the cell surface (upper panel). In csCD150- CLL samples CD150 was detected exclusively in the cytoplasm (middle panel). CD180 in csCD180- CLL samples also was restricted to the cytoplasm (low panel). Confocal microscope magnification 630x. Representative results of five independent experiments.

