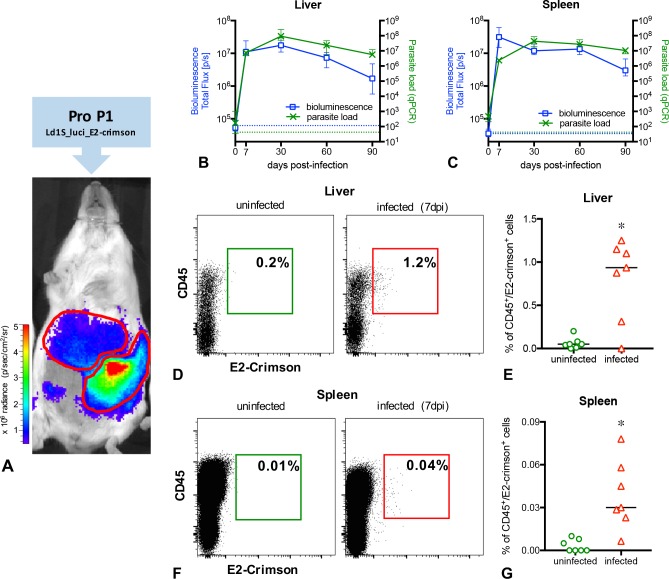
Fig 2. In vivo and ex vivo determination of the parasite load in BALB/c mice infected with P1 ‘Ld1S_luci_E2-crimson’.
(A) In vivo imaging of a representative infected mouse exhibiting positive bioluminescent signals in the liver and in the spleen. (BC) Follow-up of the infection in the liver (B) and in the spleen (C) using in vivo bioluminescence (left y-axis) and RT-qPCR (right y-axis) at different time points post-infection. Representative data of 50 infected mice, from four independent infection groups. Data are expressed as the median and the interquartile range. The dotted blue lines correspond to background signals for bioluminescence, and the dotted green lines correspond to background values for RT-qPCR. (DG) Flow cytometry analysis of liver and spleen cells from mice, using the markers CD45 (leukocytes) and E2-crimson (Ld1S_luci_E2-crimson). Representative dot plots and variations of CD45+E2-crimson+ cells in the liver (DE) and in the spleen (FG) of uninfected and infected mice at day 7 p.i. (* indicates P<0.05).

