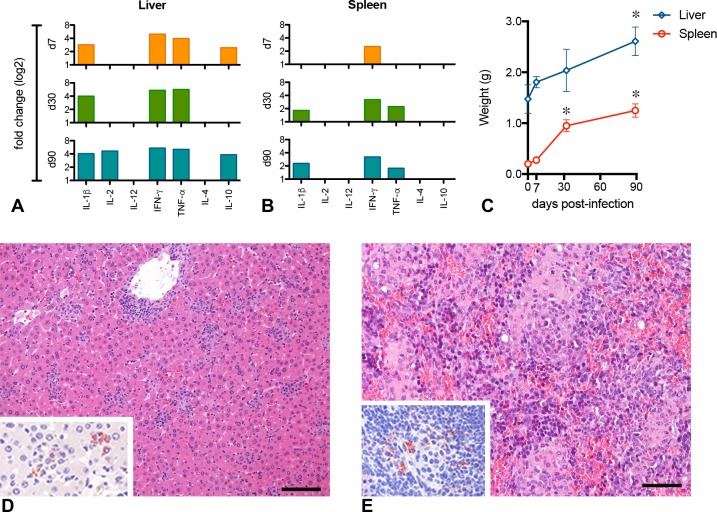
Fig 3. Inflammatory response in BALB/c mice infected with P1 ‘Ld1S_luci_E2-crimson’.
Inflammatory response assessment in the liver (A) and spleen (B) of BALB/c mice infected with Leishmania donovani. The relative gene expression of cytokines in the liver and spleen is expressed as fold change (up-regulation) for each time point post-infection. Bars represent statistically significant changes (P<0.05). (C) Follow-up of liver and spleen weight at different time points post-infection. Data are expressed as the median and the interquartile range (* time points differ significantly in comparison to day 0; P<0.05). (DE) Histopathological analysis of liver and spleen at 90 days p.i. (D) Liver with granulomas and scattered intracellular parasites (inset; immunoperoxidase). (E) Spleen presenting remarkable alterations in its architecture, with an important amount of mononuclear cells infiltration and parasites (inset; immunoperoxidase). Hematoxylin and eosin. Scale bars = 100 μm.

