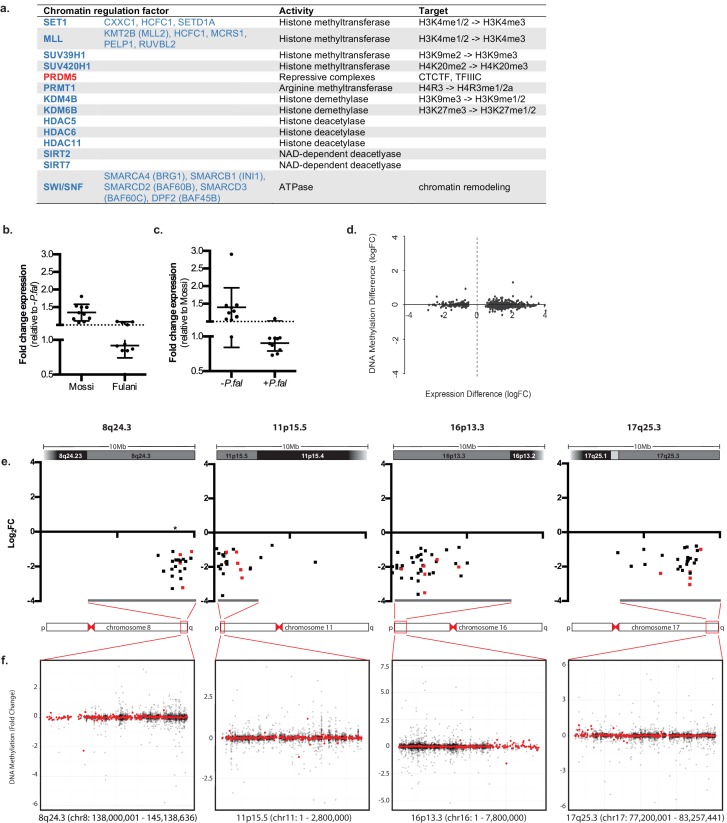
Figure 4. Regulation of chromatin in Mossi and Fulani monocytes.
(a) Table of selected DE chromatin regulation factors. (b and c) qRT-PCR analysis of selected DE chromatin regulation genes (Genes: SETD1A, CXXC1, KDM4B, KDM6B, BRG1, RUVBL2, SUV39H1, SIRT7, PHC2, PPP4C) in validation cohort of Mossi -P.fal (n = 4), Fulani -P.fal (n = 10), Mossi +P.fal (n = 8) and Fulani +P.fal (n = 5) relative to –P.fal (b) and Mossi (c) individuals (mean ±SD). (Also see Figure 4—source data 1). (d) Difference in DNA methylation at DE genes (Fulani +P.fal (n = 3) relative to Fulani –P.fal (n = 3)). (e and f) Examples of clusters of DE genes. (e) Change in expression of all significantly DE genes, in selected regions that include cytobands enriched in DE genes (Fulani +P.fal relative to Fulani –P.fal, adjusted p-valued < 0.05). Genes indicated in red are also DE in Fulani +P.fal relative to Mossi +P.fal (FDR < 0.1). * Indicates location of uncharacterised loci associated with resistance to severe P.falciparum malaria. (f) Difference in DNA methylation in selected regions that include cytobands enriched in DE genes (Fulani +P.fal relative to Fulani –P.fal, adjusted p-valued < 0.05), showing individual probes (black) and binned values (300 probes; red).


