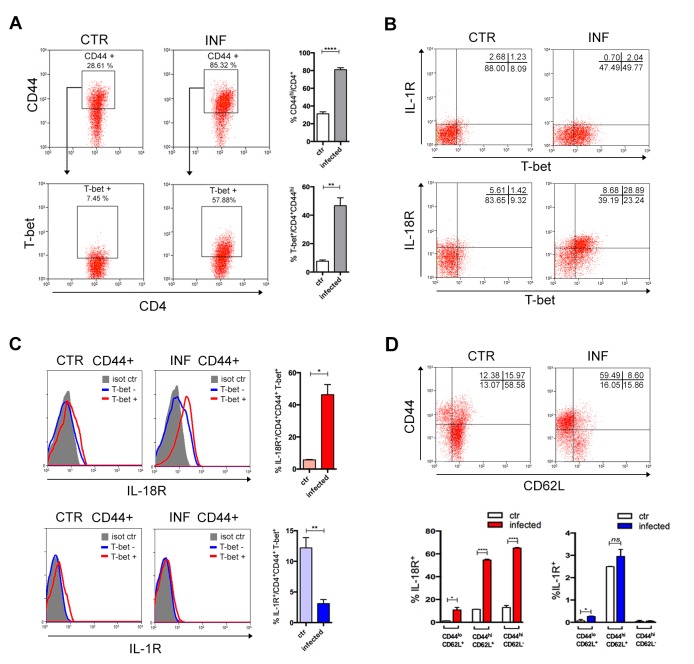
Figure 4. IL-18R, but not IL-1R, is upregulated in CD4+T cells upon activation following infection.
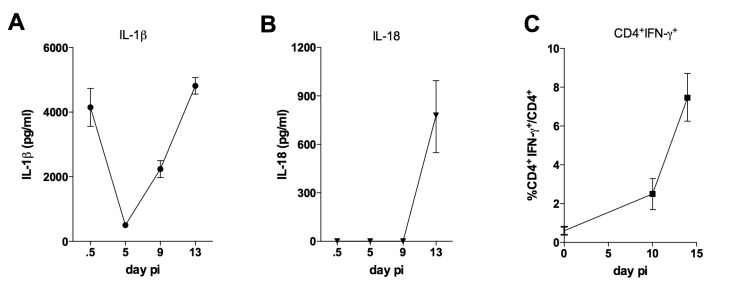
(A) Gate strategy and mean percentage of CD44hiCD4+ and T-bet+CD44hiCD4+ cells gated on CD4+ T splenocytes from non-infected controls and infected B6 mice at day 14 pi. (B) Representative dot plot of IL-1R, IL-18R and T-bet expression, gated on CD44hiCD4+ T cells as in (A). (C) Representative histograms and mean percentages of IL-1R and IL-18R expression, gated on T-bet+CD44hiCD4+ T cells, as shown in (A) and (B). (D) Representative dot plot of CD44 and CD62L expression, gated on CD4+ T cells and mean percentages of IL-1R and IL-18R expression on CD44loCD62L+, CD44hiCD62L- and CD44hiCD62L+ gated on CD4+ T cells (n = 3 to 4). Error bars = SEM, *p≤0.05; **p≤0.01; ****p≤0.0001; ns = non significant (two-tailed Student t-test). Data are representative of 3 independent experiments. Kinetics of IL-1β and IL-18 levels in the serum, as well as of the appearance of IFN-γ+CD4+ T cells in the spleen are shown in Figure 4—figure supplement 1.


