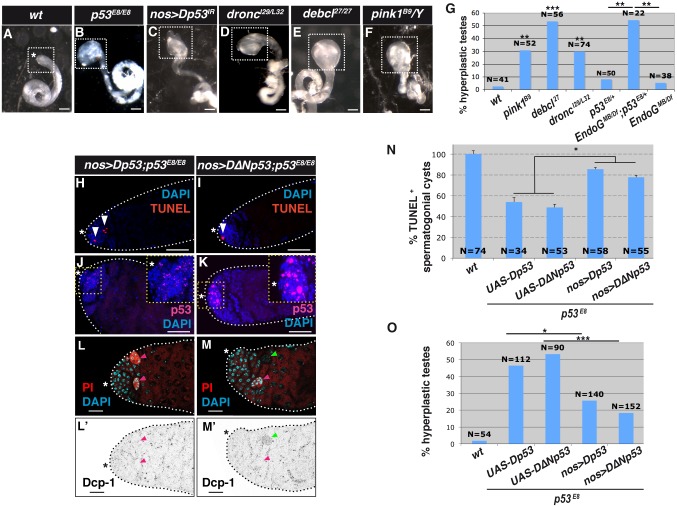
Fig 4. p53-dependent necrotic cell death suppresses testicular hyperplasia in Drosophila.
(A-F) Bright field images of testes from adult wild-type (wt; w1118, A) flies and flies lacking genes required for germ cell death (B-F). The testis apical tip and hub region are indicated by the white dotted square and white asterisk, respectively. Scale bar, 100 μm. (G) Frequency of testes with apical tip hyperplasia (mean ± s.e.m. of three independent experiments, N testes/genotype). **p < 0.01, ***p < 0.001 versus wt flies by Fisher’s exact test. (H-K) TUNEL staining (H, I) and p53 immunostaining (J, K) of spermatogonial cysts (white arrowheads in H, I) in adult testes from p53 mutant flies expressing Dp53 (H, J) and DΔNp53 (I, K) under the control of the nanos [nos]-gal4 driver. Nuclei are stained with DAPI and the hub region is indicated by the white asterisk. Scale bar, 40 μm. (L-M') Propidium iodide (PI) staining (L, M) and cleaved Dcp-1 immunostaining (L’-M’) of p53 mutant fly testes expressing Dp53 (L-L’) and DΔNp53 (M-M') under the control of the nanos [nos]-gal4 driver. PI+ and cleaved Dcp-1+ spermatogonial cysts are indicated by magenta and green arrowheads, respectively. Nuclei are stained with DAPI and the hub region is indicated by a white (L, M) or black (L'-M') asterisk. Scale bar, 20 μm. (N) Quantification of TUNEL+ spermatogonial cysts expressed as % of wt (mean ± s.e.m. of three independent experiments, N testes/genotype). *p < 0.05 by two-tailed unpaired Student’s t-test. (O) Frequency of adult testes with apical tip hyperplasia in flies of the indicated genotypes (mean ± s.e.m. of three independent experiments, N testes/genotype). *p < 0.05, ***p < 0.001 by Fisher’s exact test.

