Figure 2.
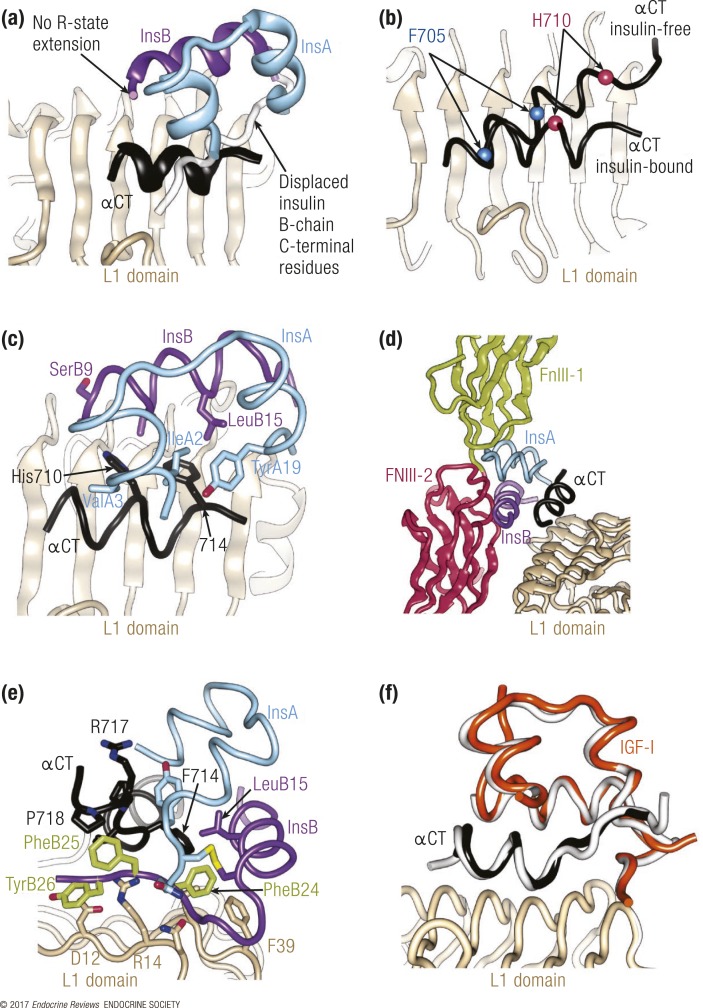
Structural biology of the interaction of insulin with its primary binding site on the receptor. (a) Overview of the insulin plus μIR complex, demonstrating the displacement of the insulin B-chain C-terminal segment (purple ribbon) away from the hormone core. (b) Rearrangement of αCT on the L1-β2 surface upon insulin binding. The C-terminal IR residues His710 and Phe714 are highlighted to show the change in the length and position of αCT upon hormone binding. (c) Engagement of the insulin core by IR residues Phe714 and His 710, highlighting insulin residues that are within 4 Å of these two receptor residues. (d) Steric overlap between bound insulin and the FnIII-1 and FnIII-2 domains upon superposition of the insulin plus μIR complex onto the structure of the apo-IR ectodomain. (e) Detail of the location of the insulin aromatic triplet PheB24-PheB25-TyrB26 within the insulin plus μIR complex. (f) Structure of IGF in complex with the IR L1-CR domain and the IGF-1R αCT segment (colored orange, light brown, and black, respectively), that is, a “hybrid” microreceptor complex, overlaid onto that of the insulin plus μIR complex (white). Unless otherwise indicated, the IR domains are colored as in Fig. 1, the insulin A chain is colored light blue, and the insulin B chain is colored purple.

