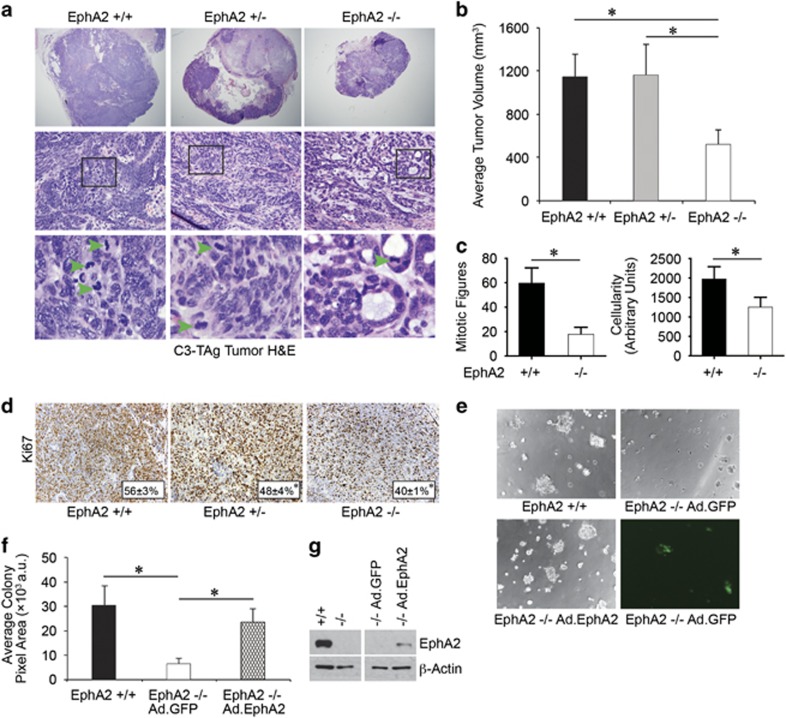
Figure 4.
EphA2-deficiency impairs growth and progression in the C3-TAg transgenic model of basal-like breast cancer in vivo. We crossed C3-TAg mice with EphA2-deficient mice, generating a cohort of C3-TAg wild-type (EphA2+/+), heterozygous (EphA2+/−) and EphA2-deficient (EphA2-/-) mice. (a) EphA2-deficient mice formed significantly smaller tumors than wild-type or heterozygous littermates. (b) Tumor volume was significantly decreased in EphA2-deficient animals relative to littermate controls (N=9+/+, 11+/− and 9−/− animals; *P<0.05, one-way ANOVA). (c) Morphometric analysis of hematoxylin and eosin-stained tumor sections revealed a significant decrease in mitotic figures (green arrowheads, a) in EphA2−/− tumors relative to +/+ controls, as well as decreased cellularity (n=6 independent tumors/genotype; *P<0.05 Student’s t-test). (d) Histologic analyses of tumor sections for proliferation marker Ki67 revealed a significant decrease in proliferation index (%Ki67+ nuclei/total nuclei; *P<0.05, Student’s t-test) for EphA2−/− tumors relative to controls. (e, f) Primary tumor cells from EphA2+/+ and EphA2−/− C3-TAg tumors were isolated and grown in three-dimensional spheroid cultures on Matrigel for 10–12 days. EphA2−/− cells formed significantly smaller colonies than EphA2+/+ cells (e, f; *P<0.05, Student’s t-test). Expression of EphA2 in EphA2−/− cells via adenoviral transduction rescued colony size (e, f; *P<0.05, Student’s t-test) relative to adenovirus GFP control (expression confirmed by fluorescence analysis, lower right panel, e), restoring growth to near wild-type C3-TAg levels. N=3 independent experiments with triplicate biological replicates for each cell line. (g) EphA2-deficiency and overexpression of EphA2 following adenoviral transduction were confirmed by immunoblot analysis.

