
Figure 1.
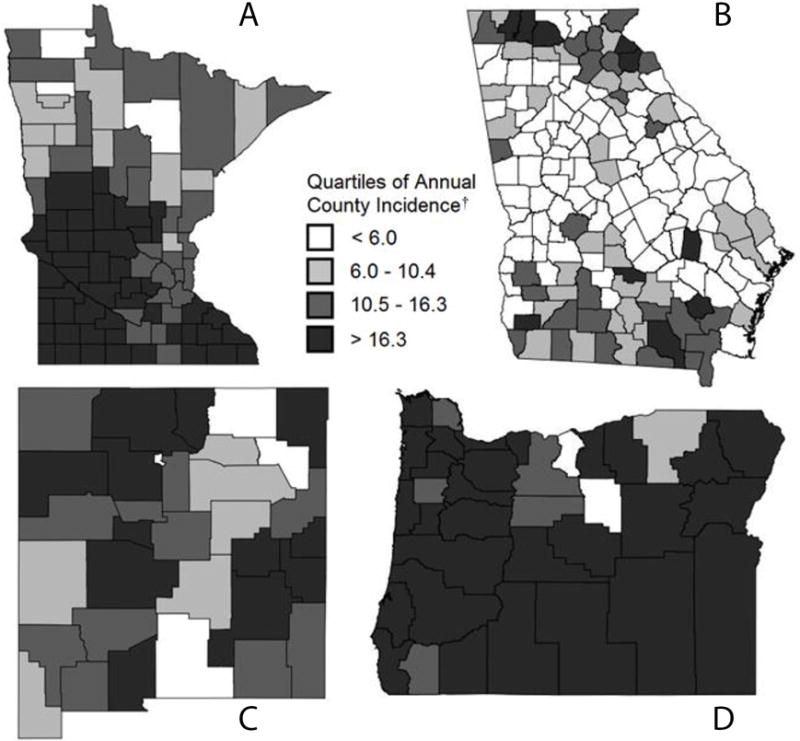
Observed county incidence per 100000 in A) Minnesota, B) Georgia, C) New Mexico and D) Oregon in 2011. Counties are shaded based on the quartiles of county annual incidence per 100000.
Official websites use .gov
A
.gov website belongs to an official
government organization in the United States.
Secure .gov websites use HTTPS
A lock (
) or https:// means you've safely
connected to the .gov website. Share sensitive
information only on official, secure websites.
Observed county incidence per 100000 in A) Minnesota, B) Georgia, C) New Mexico and D) Oregon in 2011. Counties are shaded based on the quartiles of county annual incidence per 100000.