
Figure 2.
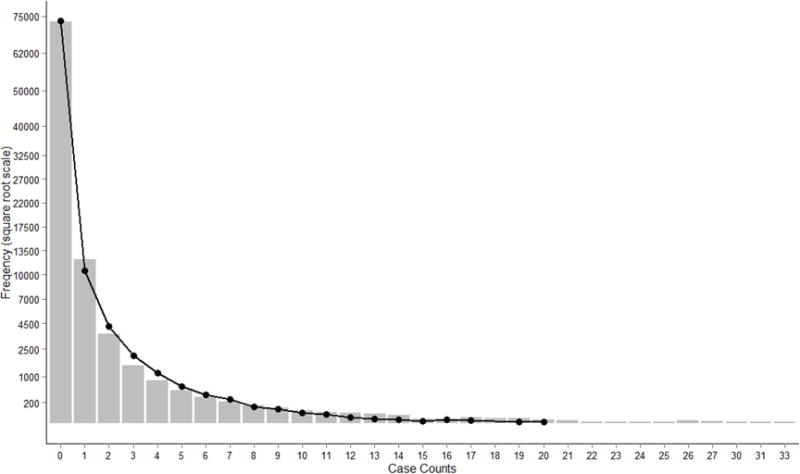
Count frequency of Campylobacter cases in FoodNet (bars) with normal negative binomial curve overlay (number of observations= 92736, mean = 0.434, theta = 0.213). Y axis is shown using a square root scale.
Official websites use .gov
A
.gov website belongs to an official
government organization in the United States.
Secure .gov websites use HTTPS
A lock (
) or https:// means you've safely
connected to the .gov website. Share sensitive
information only on official, secure websites.
Count frequency of Campylobacter cases in FoodNet (bars) with normal negative binomial curve overlay (number of observations= 92736, mean = 0.434, theta = 0.213). Y axis is shown using a square root scale.