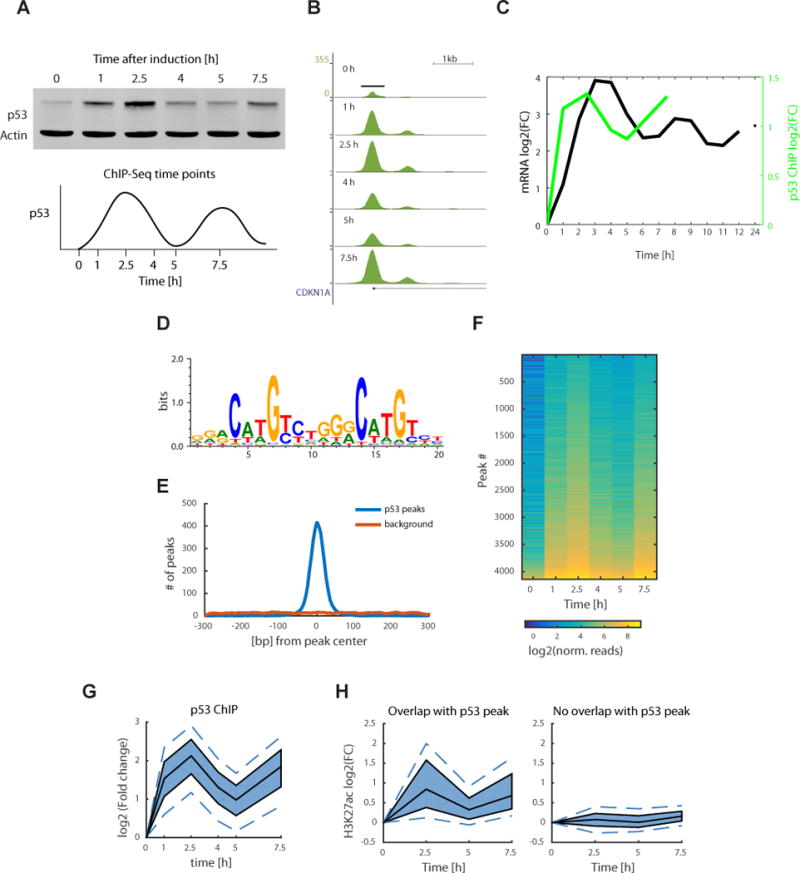
Figure 2.

Time course p53 ChIP-seq experiment shows pulsatile dynamics genome wide. (a) Western blot of p53 protein levels, with actin as a control, at the selected time points for the ChIP-seq experiment sampling the first two p53 pulses (uncropped gel image in Supplementary Data Set 5). (b) p53 ChIP peak at the CDKN1A promoter with signal normalized to the total number of reads in each sample (UCSC tracks generated by HOMER software). (c) Quantification of the log2(FC) of p53 ChIP peak in b plotted with p21 mRNA dynamics from the mRNA-seq experiment. FC, fold change. (d) De novo motif found using the HOMER software present in 86.6% of the peaks (1.5% of background genomic regions) and plotted using WebLogo. (e) Distribution of motif (from d) start positions relative to the p53 peak centers. (f) Heat map of normalized reads in a total of 4141 p53 ChIP peaks, ordered by peak intensity. (g) Quantile plot of p53 ChIP peak log2(FC). The area shaded in dark blue represents the interquartile range, the black lines indicate the median, and the lower and upper dashed blue lines show the 10th and 90th percentiles, respectively. (h) H3K27ac ChIP was done at 0, 2.5, 5 and 7.5 h time points. Quantile plot shows H3K27ac ChIP peaks that overlap with the p53 ChIP peaks (left, 1,075 peaks) and of H3K27ac peaks that do not overlap with p53 (right, 26,153 peaks).
