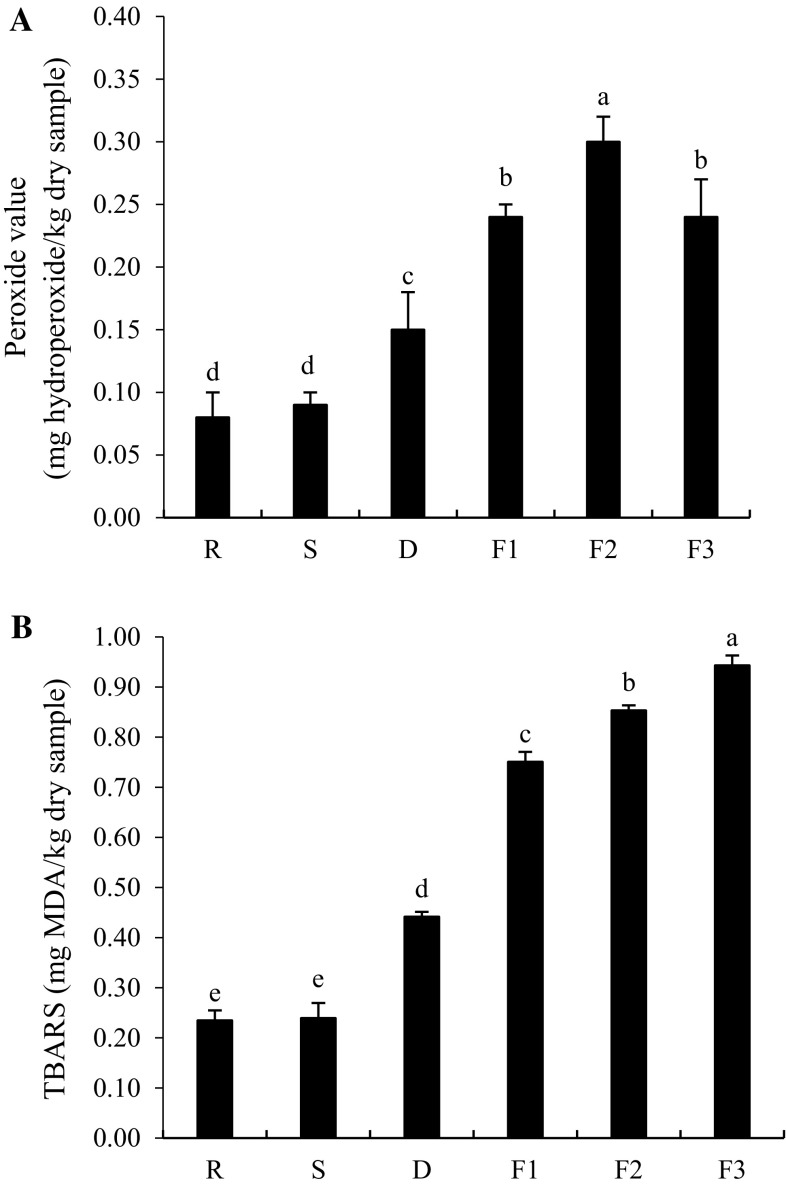
Fig. 3.
Changes in peroxide values (a) and TBARS values (b) of shrimp during Kapi production. Bars represent the standard deviation (n = 3). R raw material, S after salting, D after drying, F1, F2 and F3 after fermentation for 10, 20 and 30 days. Different letters on the bars indicate the significant differences (P < 0.05)

